What's the difference between a process map, process model and a flowchart?
There are many terms for diagrams that show a series of steps and decisions - flowchart, process diagram, process map, workflow, and process model. While many sources claim large differences between these terms, in practice, they are used interchangeably.
Flow diagrams can be used to show how various types of ‘things’ move through a process or system: data, control, materials, systems, users, tasks, and so on.
They are used to document all the steps and decisions, and inputs and outputs of a process, aiming to achieve one or more of the following:
- train new employees faster
- optimise or standardise a repeating process
- debug errors or quality problems
- define task and decision roles and responsibilities
- document processes for security and quality accreditation purposes
What’s the difference between flowcharts and process models?
The consensus seems to use flowcharts and workflows to refer to the more basic diagrams, and process models or process maps for the more complex diagrams, especially those that use standardised notations.
Process mapping is the act of drawing these diagrams and documenting business and system processes in great detail.
Basic process model shapes
Flowcharts got their own ANSI standard in the 1960s, which was then incorporated into the ISO 5807 standard in the 1980s, last reviewed in 2019.
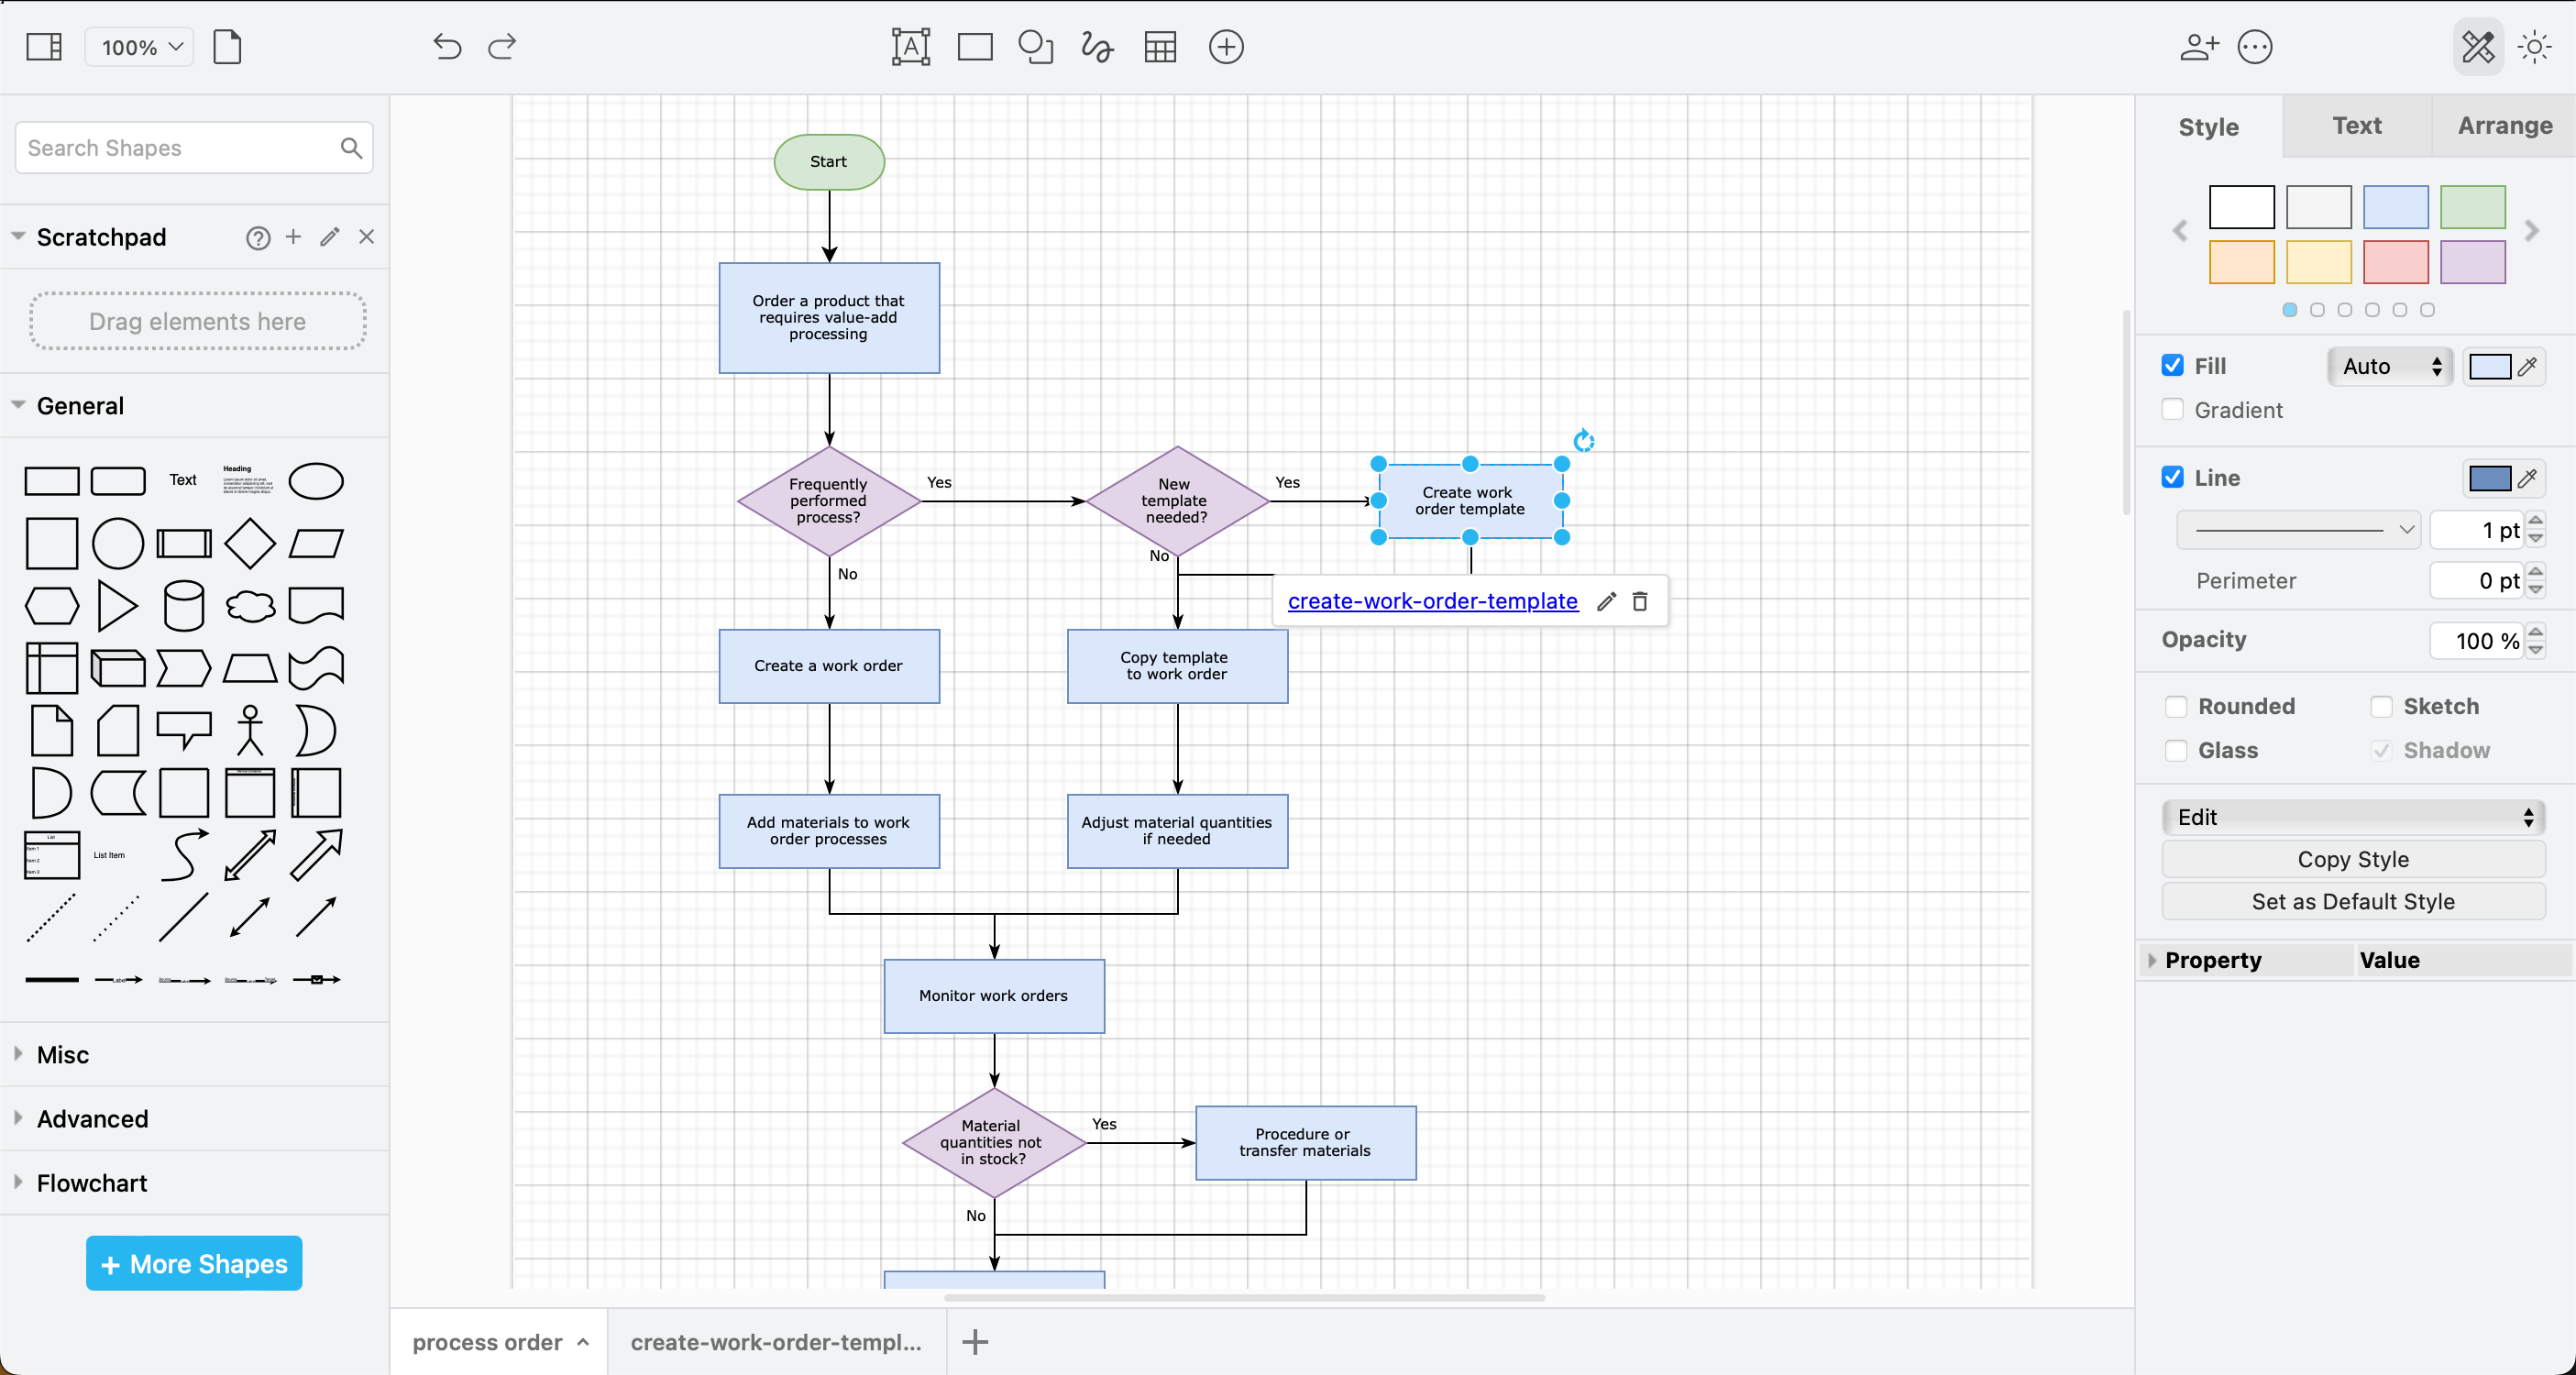
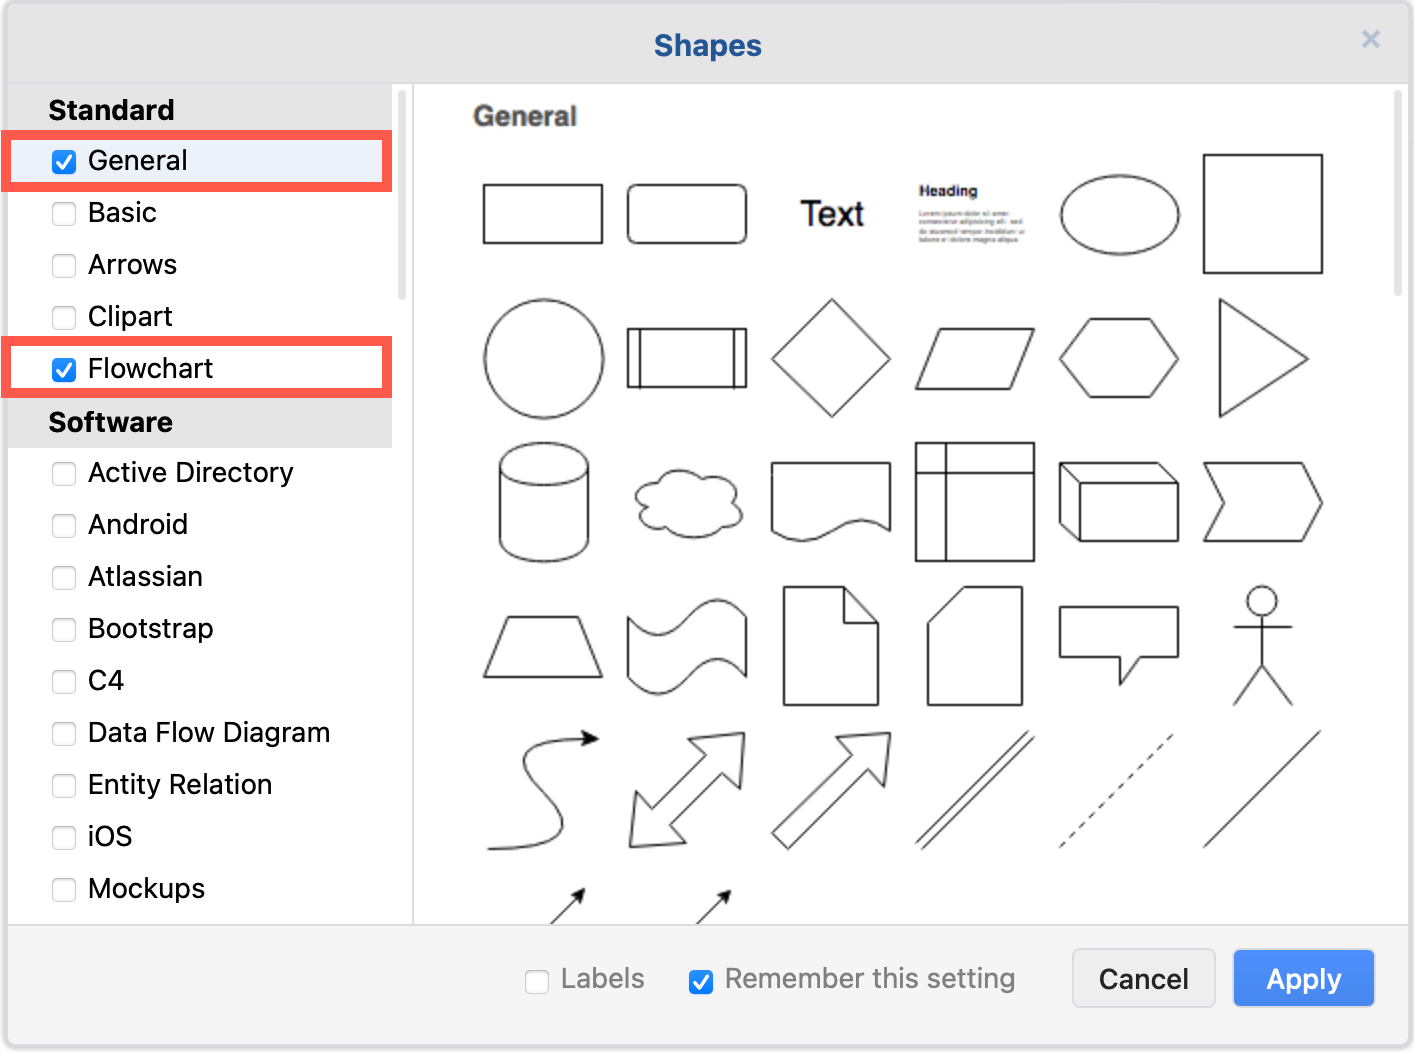
The basic flowchart shapes are available in the General shape library, which is enabled by default. For shapes to represent magnetic tapes, punch cards, punch tapes, and other types of data storage, enable the Flowchart shape library.
Click More Shapes at the bottom of the shapes panel to select the shape libraries you want to use.
Ovals - indicate the start and end of a process. Often an open oval for the start, and a closed or double oval for the end, but sometimes drawn as a circle or a rectangle with rounded ends.
Rectangles - show tasks or steps in a process, usually drawn with sharp corners to distinguish them from start/stop. A step can be another entire process, and with draw.io linked to a second diagram page to fully document that flow.
Diamonds - indicate decisions, usually showing only two paths and a yes/no or true/false question.
Connectors with arrows at one end join these shapes together to show the paths through the process.

Tip: Use whichever colours make your diagram easier to understand.
Extended flowchart shapes
- Rhomboid - data input or displayed output
- Rectangle with vertical bars - a subprocess defined in another diagram
- Cylinder - a data store, database or disk drive
- Rectangle with a wavy base - one or more documents
- Trapezoid - a manual process performed by hand
- Rectangle with a sloping top - manual input step
- Hexagon - preparation or initialisation steps
- Pentagon - the target step is on another page/in another diagram
- Solid or double bar - a fork or split in a process into parallel steps. Also used to join separate paths in a process together.

Follow this tutorial to create a basic flowchart in draw.io
For complex flowchart template examples, see the Flowcharts section in the template manager (Arrange > Insert > Template via the menu or + > Template in the toolbar)
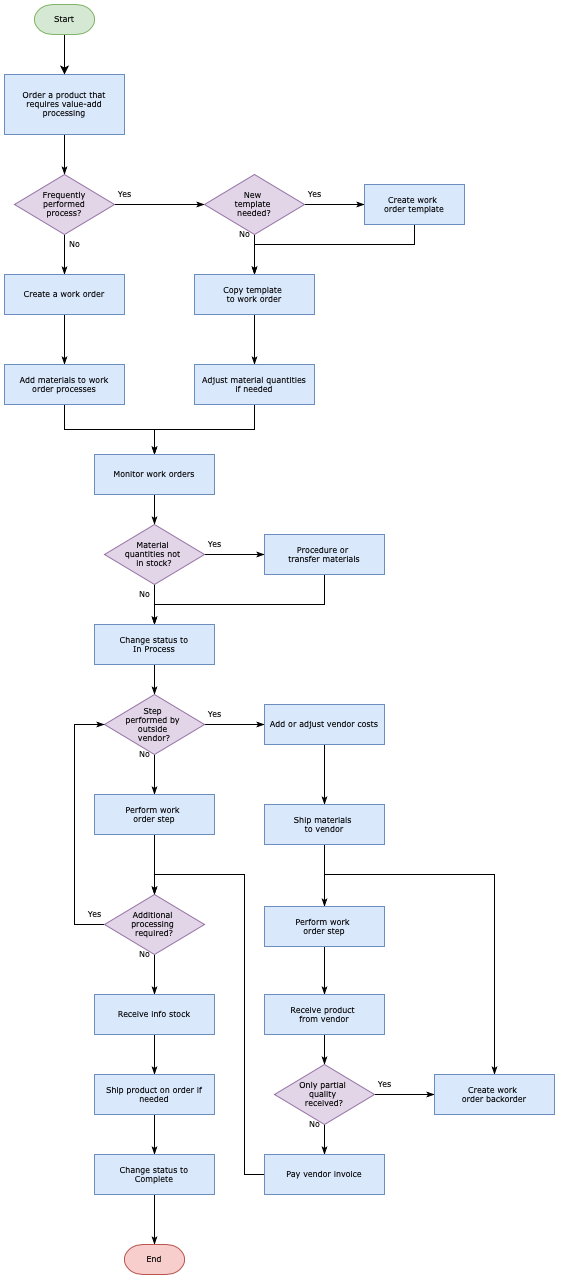
Vertical or horizontal process models?
Use whichever layout is easier for your audience to read and understand.
For example, use vertical for printed documentation, and horizontal when enlarged and taped up on a wall above an assembly line.
Multilingual diagrams: Keep in mind that some languages are read top down or right to left. To avoid confusion, use clear start and end shapes when drawing a diagram that will be translated.
The automatic layout shapes in the Advanced shape library can help you assemble a flowchart quickly.

Alternatively, use a smart template in draw.io to generate a diagram from a description of your process. Here’s how to write a good query to generate a diagram.
Detailed and complex process diagrams
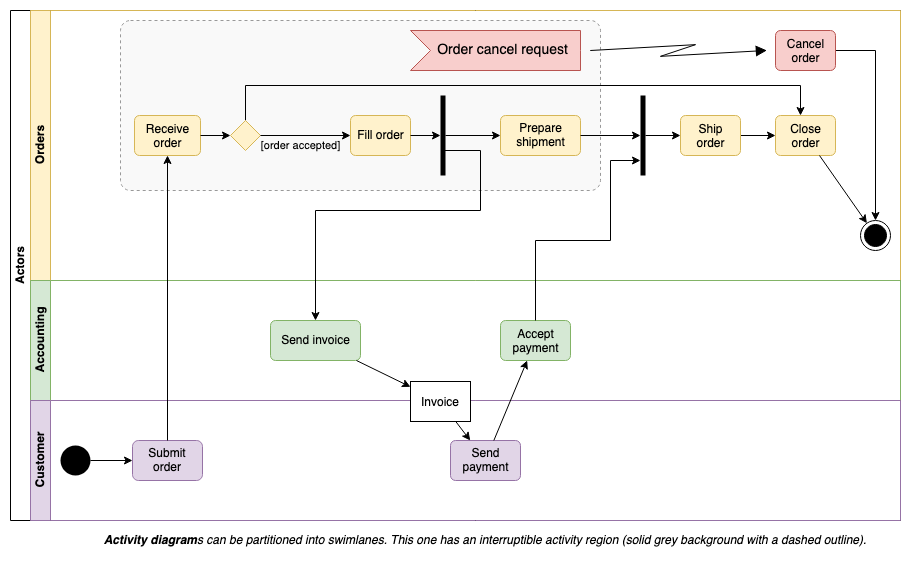
Swimlane diagrams, cross-functional flowcharts or deployment flowcharts all use lanes to indicate the actors or systems that perform the steps and decisions in a flow. Use a cross-functional table in draw.io to draw a process with swimlanes easily.

BPMN diagrams are one of the more complex types of flowcharts and follow the BPMN 2 notation standard. Choreography models show the interaction between people throughout a process, and orchestration diagrams show the task order. Most BPMN diagrams are a combination of these two flows.
- Specific icons are attached to traditional flowchart rectangles to indicate types of tasks.
- Circular shapes are used in between tasks to show a wide range of events, both ‘catching’ and ‘throwing’.
- Diamond gateway shapes indicate decisions, where paths split and merge.
- Pools containing swimlanes are used to group the teams and roles responsible for each step, event and decision in a process.

Related diagram types
Don’t confuse flowcharts with process flow diagrams that are used in chemical engineering. Also called PFD diagrams or process flow sheets, these typically show piping, equipment, operation data, and process and recycling streams.

However, some IT security sources now use this term (PFD) for one of the diagrams used in threat modelling.

Data flow diagrams use a more limited set of shapes to show how data is passed between processes, datastores and external actors or systems.

UML activity diagrams and sequence diagrams model flows of information and control through a system or program.