Diagrams for retail - customer paths and planograms
You can use diagrams in many ways in retail, including to visualise customer shopping data, to plan customer journeys, to analyse and optimise your retail space, and to improve workflows for both customers and co-workers.
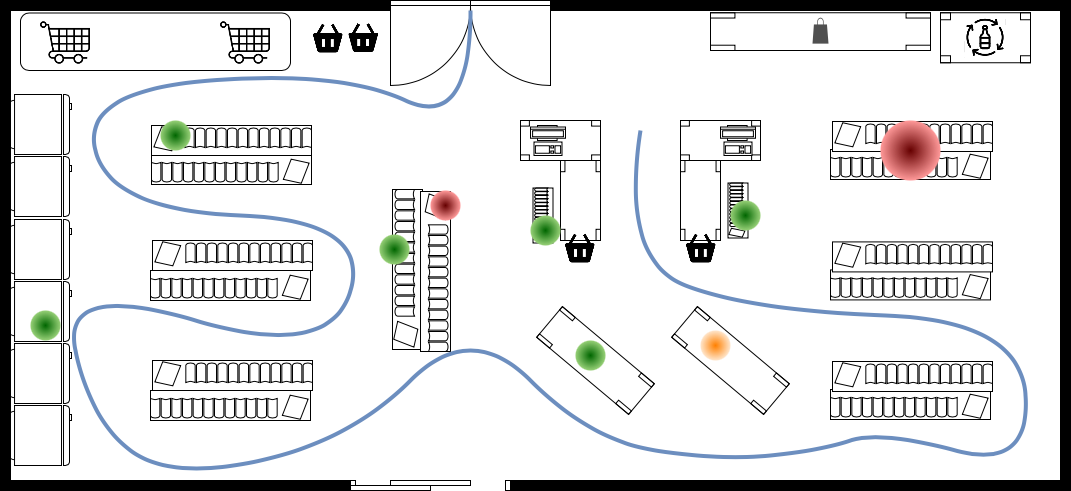
Bend connectors around a floor plan to visualise the main paths customers take through your store.
Indicate best and worst sellers with hotspots on different layers to visualise sales performance against shelf and floor plan positions.
Link each shelf to a planogram on another diagram page - it is easier to analyse sales performance when you keep the visualisations together in one diagram file. Drop photos and product images into a container table to draw an easy planogram of a shelf or window display.
As draw.io comes with a wide range of shape libraries built-in, you don’t need multiple specialised diagramming tools to draw many different types of diagrams.
Show customer foot traffic on a floor plan
Click on More Shapes at the bottom of the shapes panel and enable the Floorplans shape library. Use these shapes to map out your retail space.

Now you can bend a curved connector to follow the path that customers typically take through your store.
- Connect the entrance with the checkout.
- Set the curved connector style via the Style tab in the format panel. Set the connector Waypoints to straight.
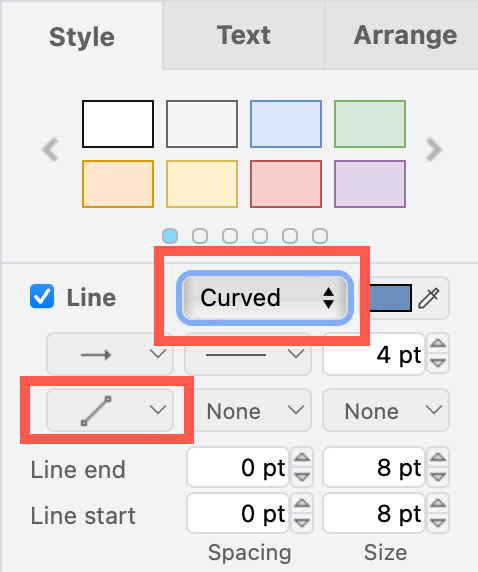
- Drag the waypoints of the connector until the connector follows the path your customers take. You can even drag connectors into loops.
Use layers to organise visual information
Keep your floor plan separate from customer paths and sales data by using layers. This will let you add multiple customer paths more easily.
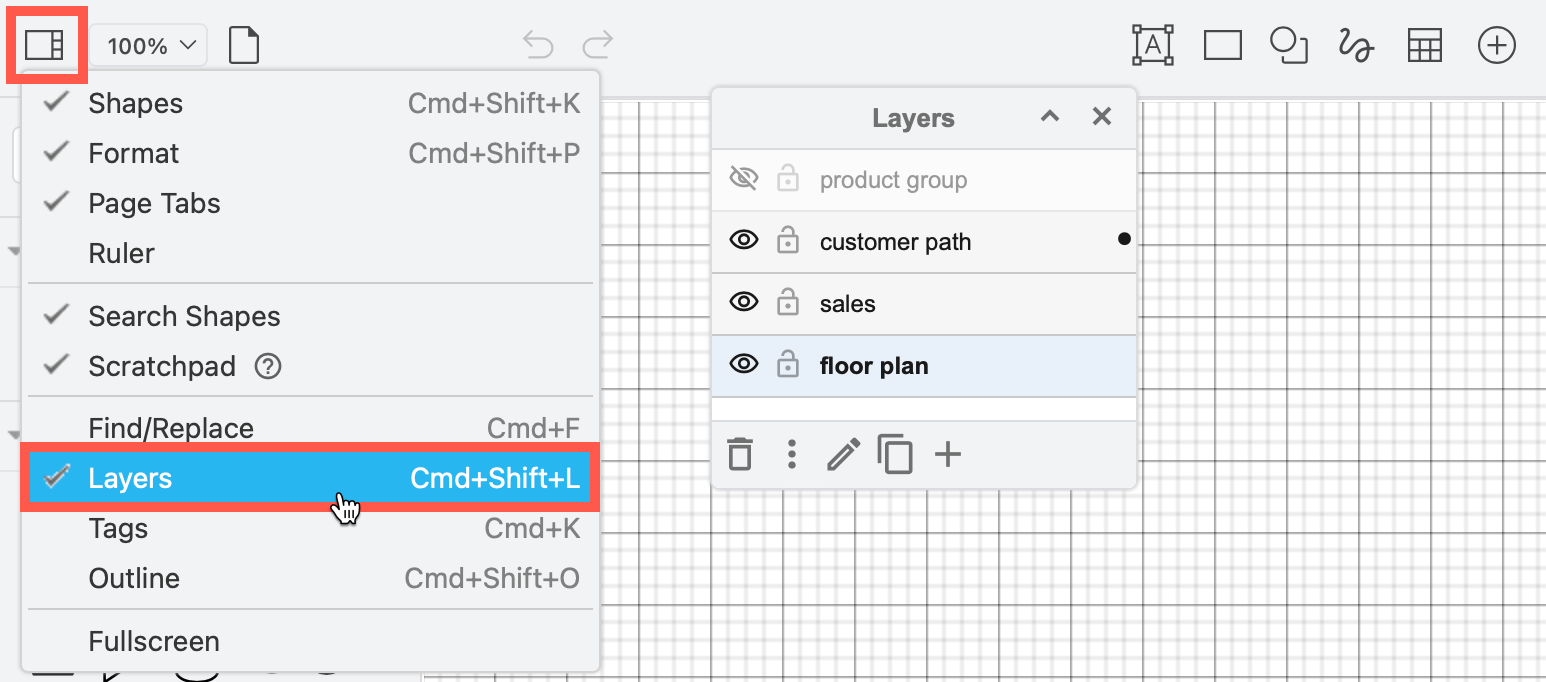
Enable the Layers dialog: Click on View in the toolbar and enable Layers.
Work with layers: Use the layers dialog to add, rename and organise your diagram’s layers.
- Click + at the bottom of the Layers dialog to add a new layer.
- Double click on the name of a layer to edit and rename the layer.
- Drag a layer up or down the list to move it above or below another layer.
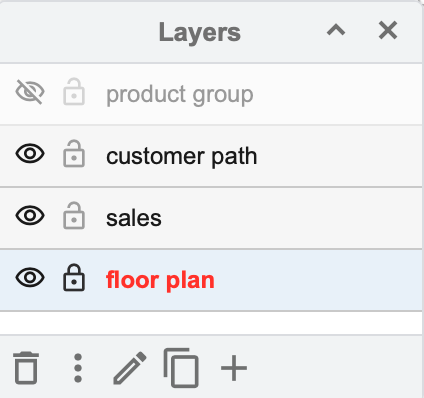
- Click on the eye icon to the left of the layer name to hide or show that layer.
- Click on the lock icon to ensure no changes can be made to that layer. A locked layer’s name will be shown in red.
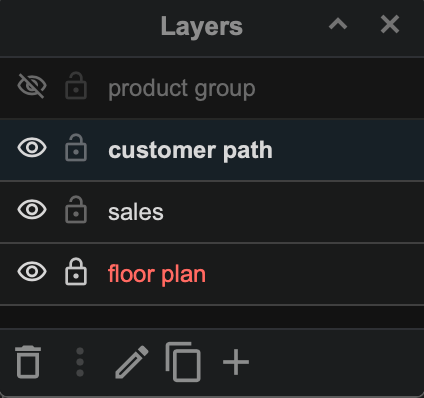
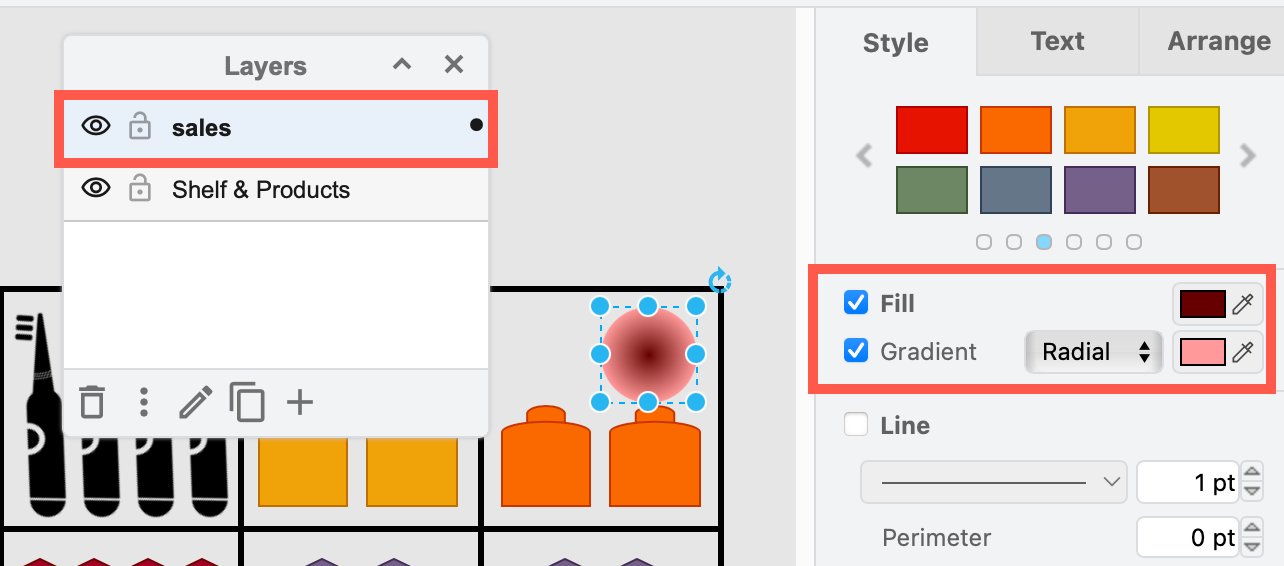
Add shapes to a layer: Make sure you select the layer you want to add a shape or connector to - the currently selected layer is indicated with bold text and a different background colour (blue in light mode, grey in dark mode).
For example, the sales layer has been selected in the dark mode screenshot below.
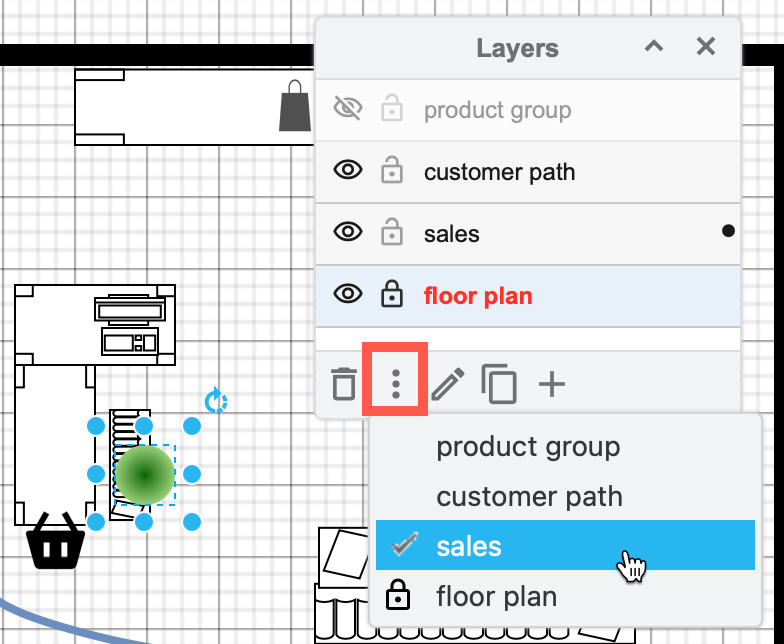
When you select a shape, a dot will appear to the right of the layer it is on. Note that you can select shapes that are on other layers - for example, the selected green hotspot in the screenshot below is on the sales layer, but currently the floor plan layer is selected.
Move shapes to another layer: Select shapes and connectors, then in the Layers dialog menu (three horizontal lines), click on Move Selection to and select the target layer.
Learn more about working with layers
Draw a planogram of a shelf or display
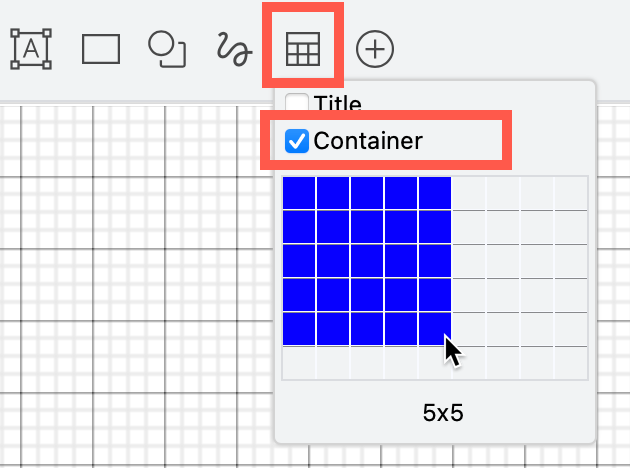
Add the shelf as a container table
Click on the table tool, enable the Container checkbox and click on grid below at the position that matches the number of shelves vertically, and maximum variety of products horizontally.
Get rid of the title rows and columns
Click on a table cell and drag the orange diamond on the title separator line to the outer edge of the table so it disappears. Do this once for the horizontal title line and the vertical title line.
Add products to the planogram shelves
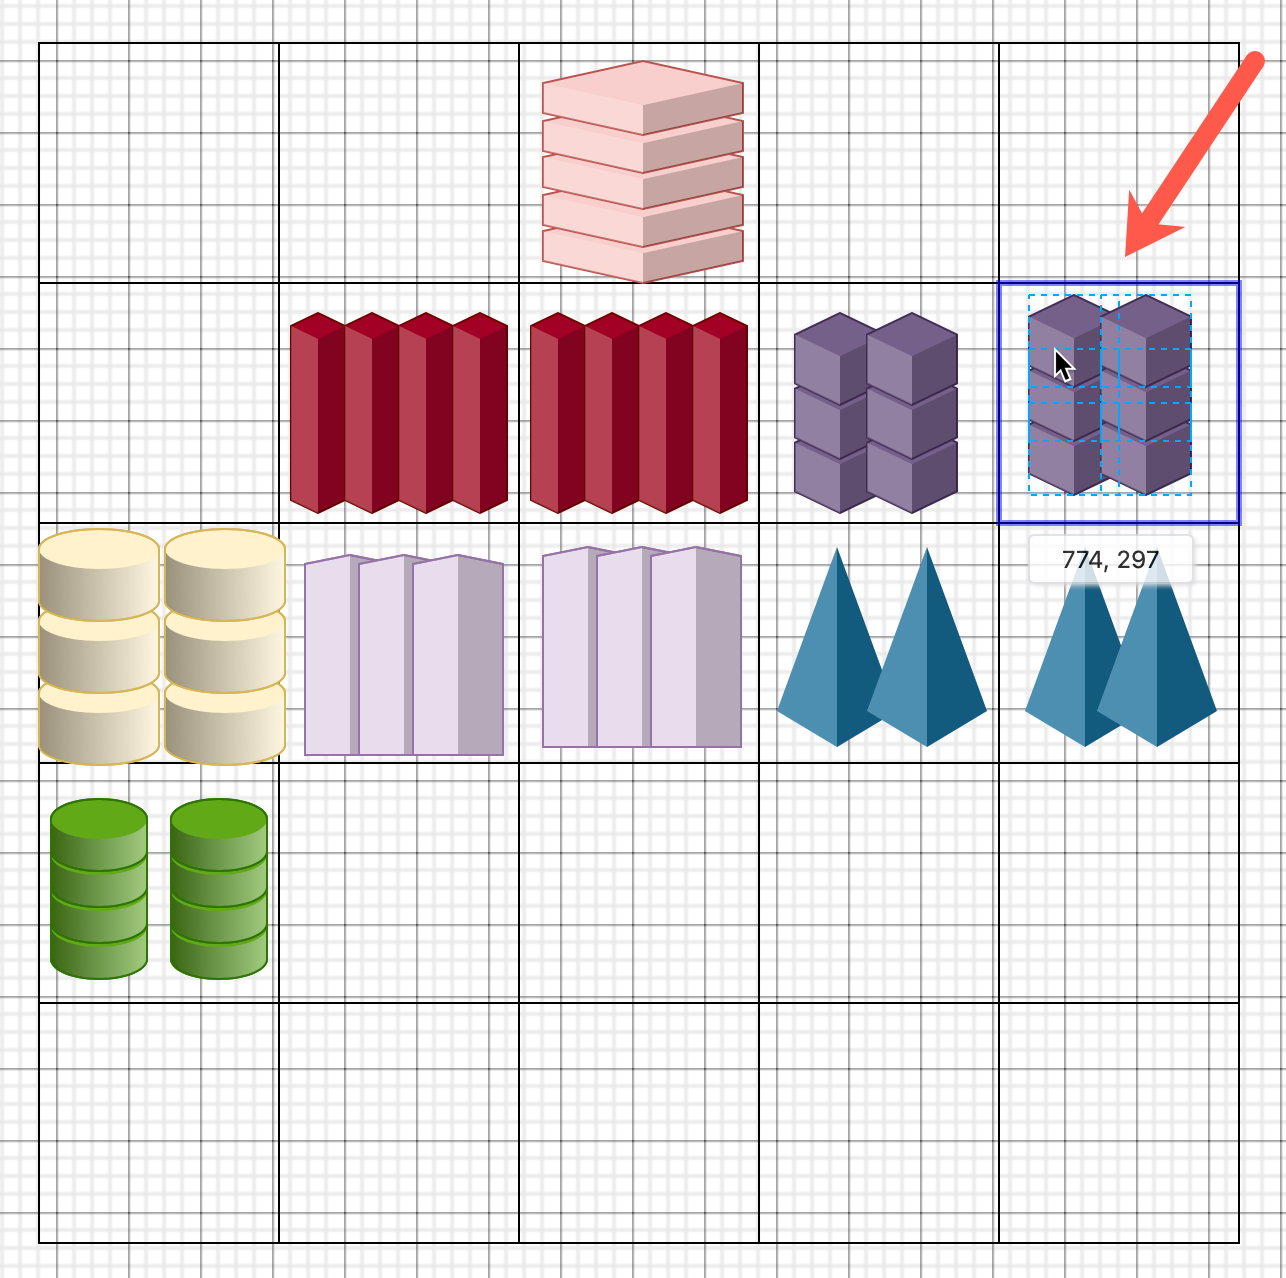
Drag a photo of a product or group of products from your computer and drop it into a table cell when it is highlighted in purple.
Alternatively, mock-up products with appropriate colours and shapes from the draw.io shape libraries. You can search for shapes, use shapes from the Infographic and other shape libraries to represent products.
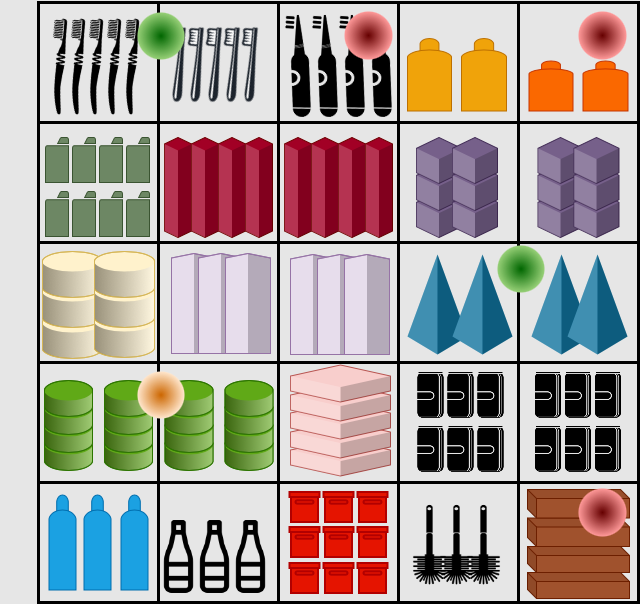
Add hotspots to planograms to indicate sales performance
- Click View in the toolbar and open the Layers dialog.
- Add a new layer and make sure it is selected.
- Drag circles from the shape library onto the best and worst sellers.
- Use the Gradient style with a dark and a light value of the same colour. Disable the Line outline on the shape to make it appear like a hotspot.
Link a shelf in the retail floorplan to a planograms
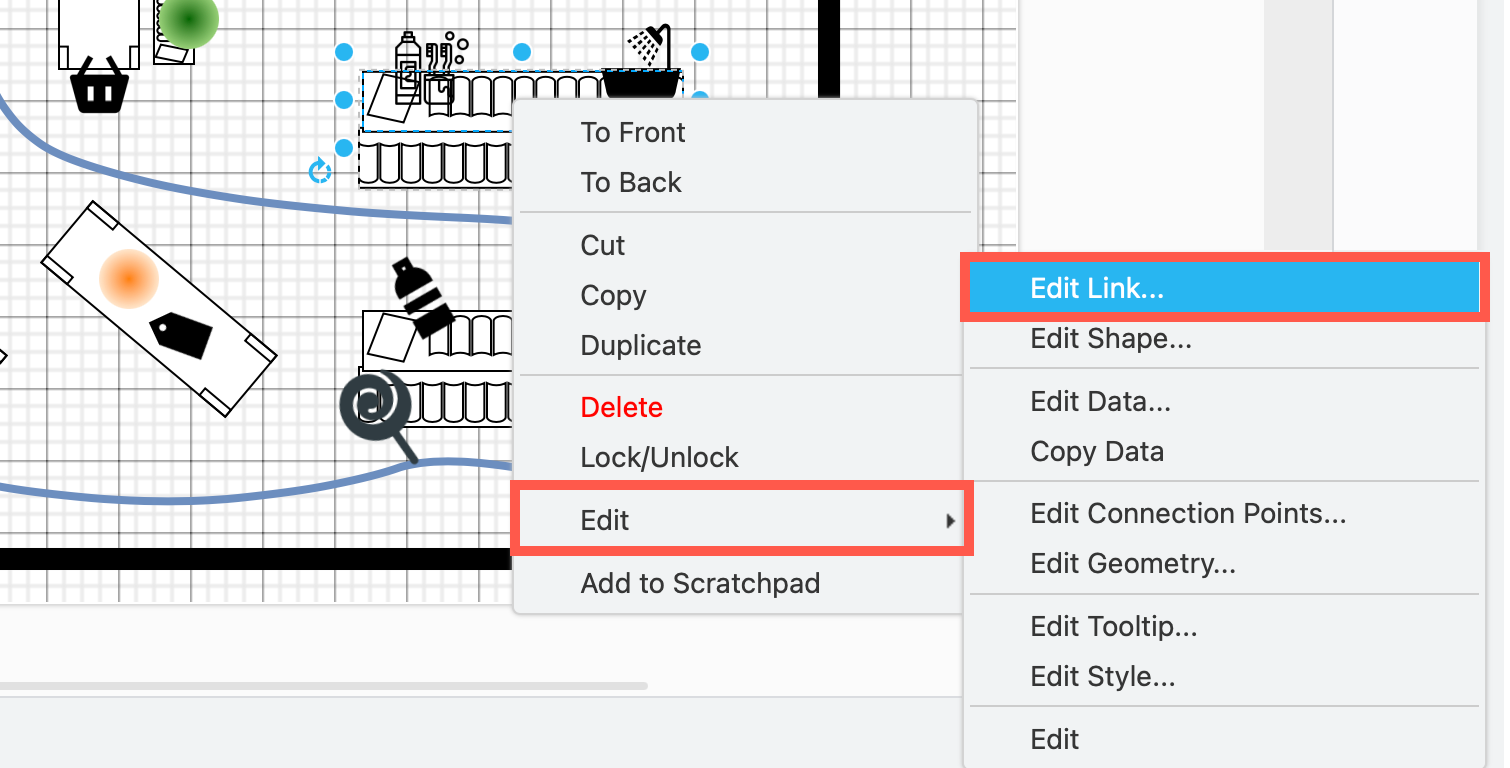
Right-click on the shelf in the floorplan and select Edit Link.
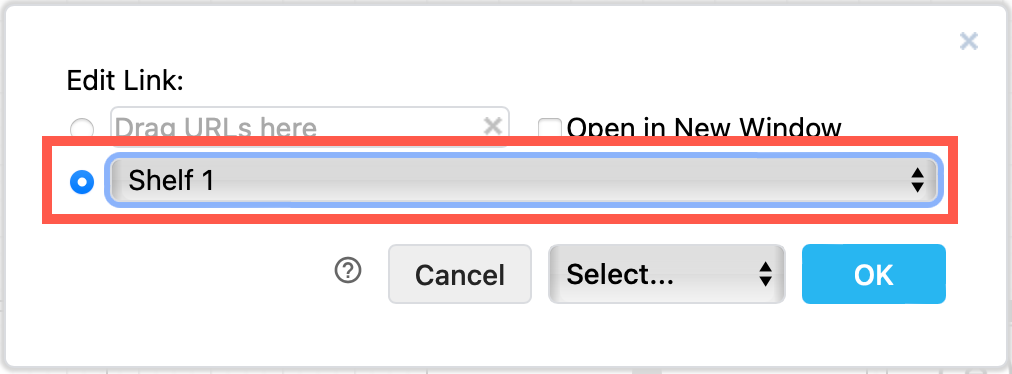
Select the diagram page containing that shelf’s planogram from the drop down list and click OK.
Navigate to the planogram from the floorplan
On an unlocked layer, click on the shelf shape to see a link appear in the tooltip below. Click on the link to jump to that page.
On a locked layer, the mouse pointer will change to indicate it is a link when you hover over the shelf shape. Click on the shelf to jump to that diagram page.
More diagrams for retail
Use flowcharts or BPMN diagrams to document and analyse customer purchase flows, and internal business processes.
Draw story maps to analyse customers’ needs and better target your products, services and retail layout.