New built-in SAP shape library for BTP solution diagrams
BTP solution diagrams document your SAP Business Technology Platform architecture to show its services, environments, systems and interdependencies. Using the standard SAP icon set in your BTP solution diagram ensures that teams from various departments can understand your diagram immediately - from IT service managers and CTOs to SAP consultants and solution architects.
Enable the SAP shape library in draw.io
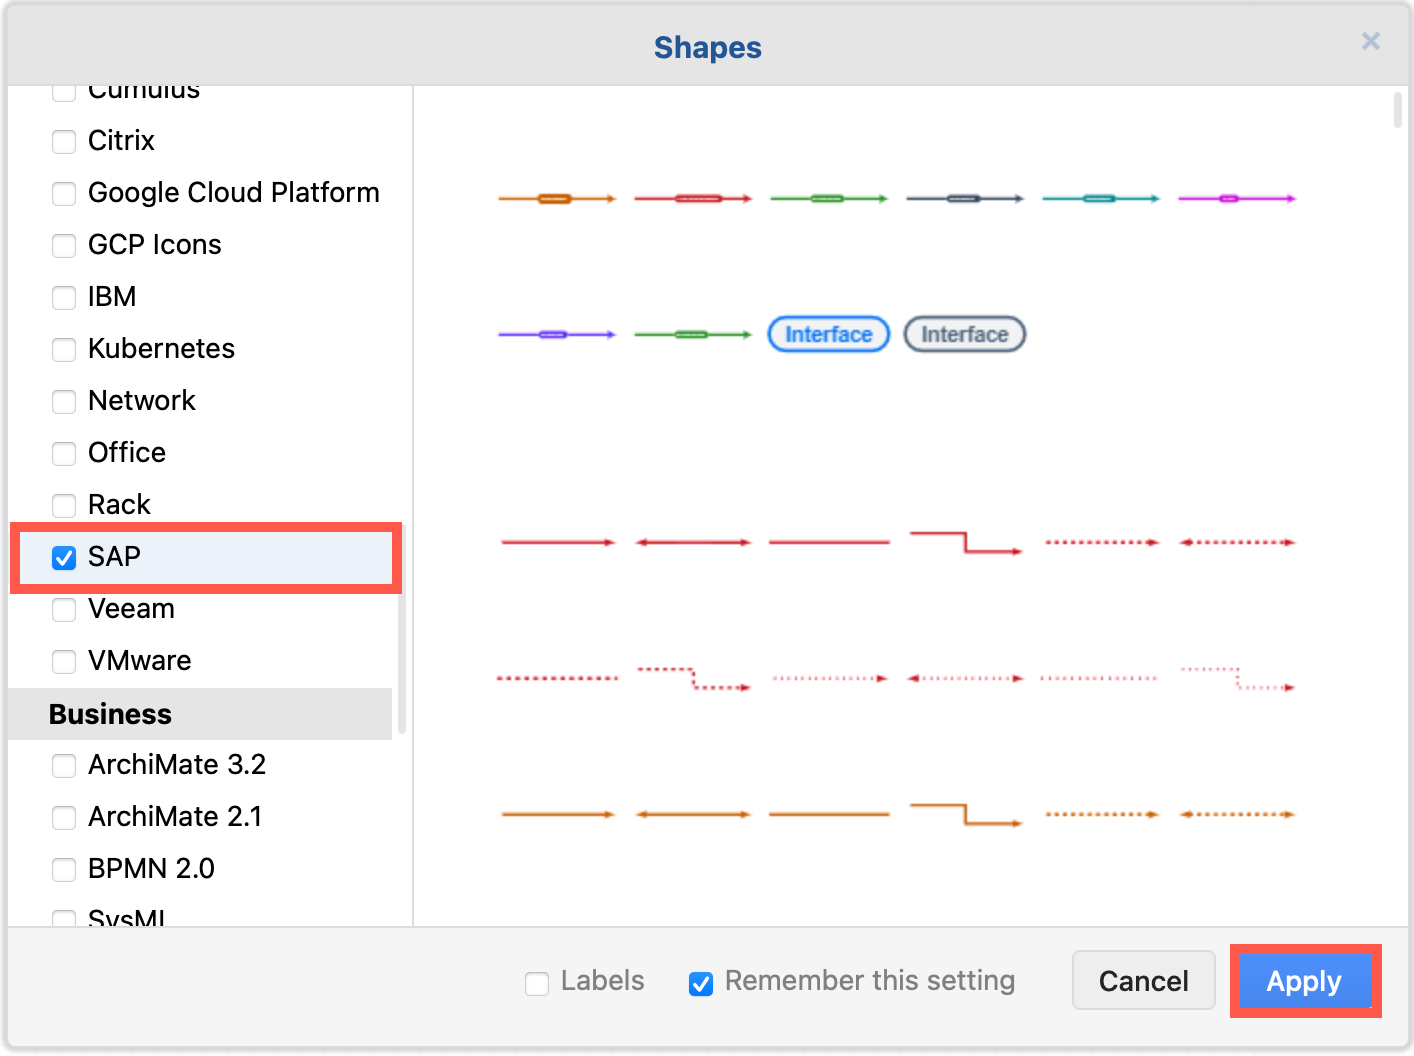
- Click on More Shapes at the bottom of the shapes panel in draw.io.
- Enable the checkbox next to the SAP shape library in the Networking section and click Apply.
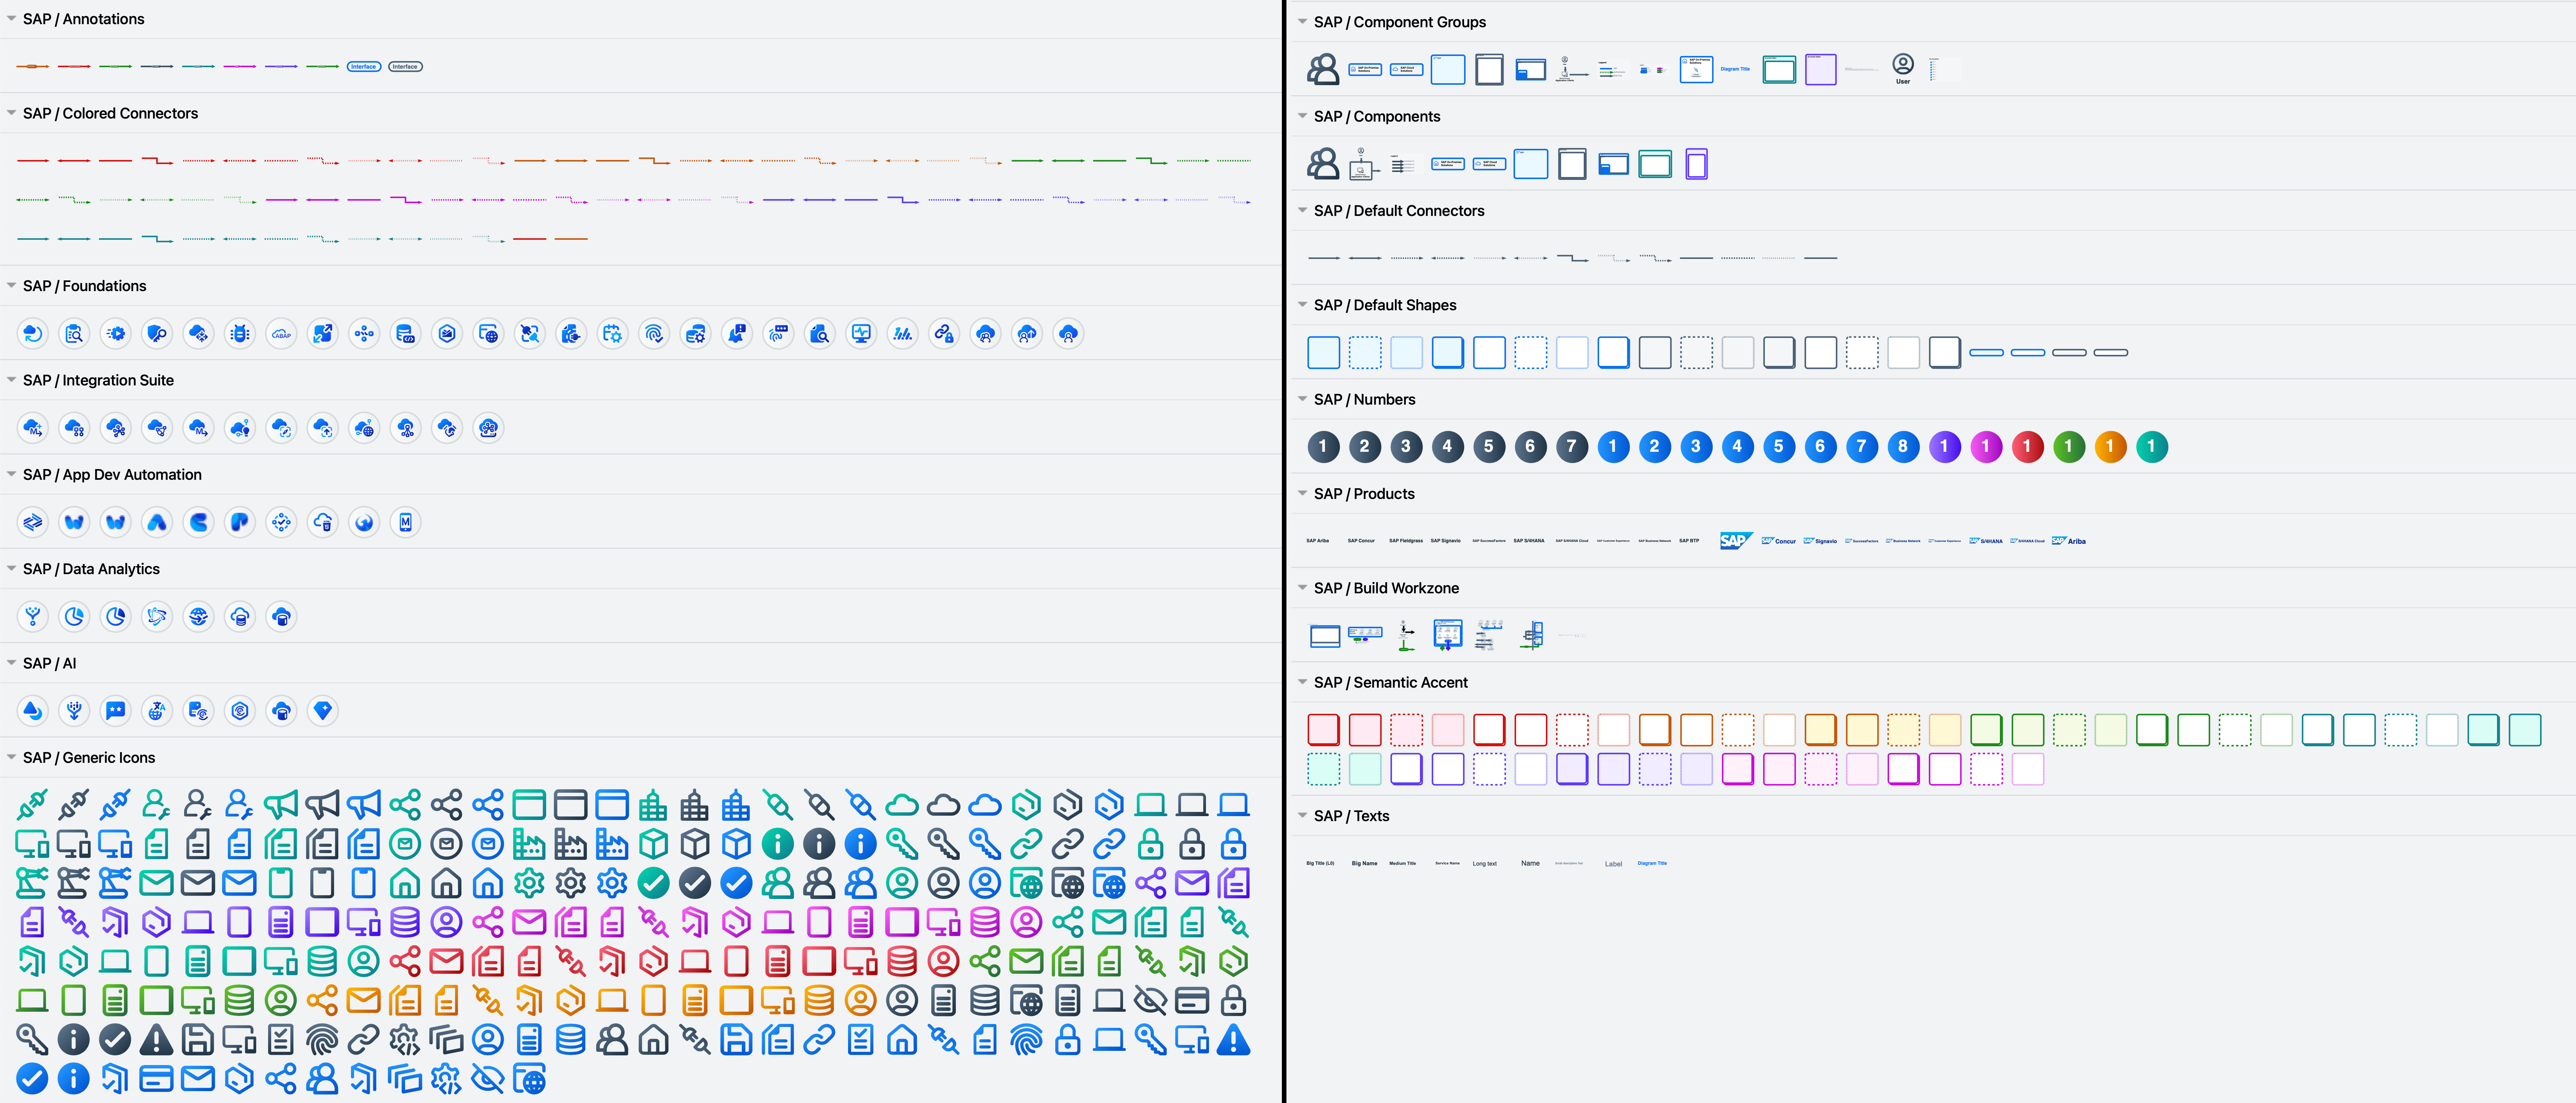
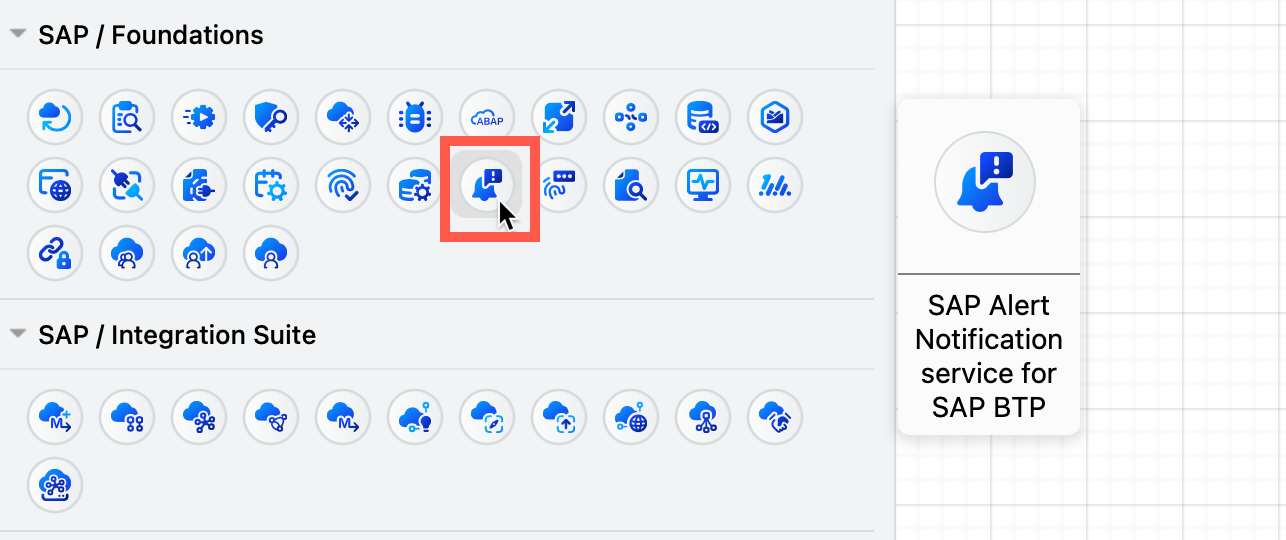
The SAP shapes will be sorted into various categories in the shape panel. Hover over any shape to see a larger preview and description.
Tips for drawing BTP solution diagrams
-
Include a diagram legend, especially when using colour-coded connectors and shapes to indicates roles, user types or providers.
-
Create BTP diagrams in draw.io first, then embed them into PowerPoint slides with the free draw.io add-on.
-
Use regions - boxes with rounded corners in the Default Shapes category in the SAP shape library - to group related components. Add a label or icon in the top left for quick identification. Nested regions indicate sub-systems.
-
Use the Numbers shapes in the SAP shape library to indicate an order along a specific path.
Levels of BTP solution diagrams for different audiences
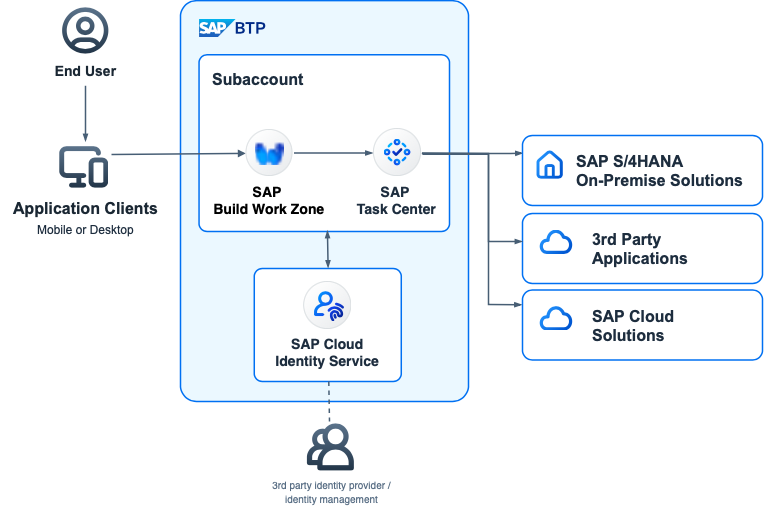
Level 0: Overview
The top level BTP solution diagram provides a broad overview of the main components in your SAP architecture, with few technical details. aimed at an executive level audience. Keep only the essentials in this diagram, with few connectors and short descriptions.
Open this example in the draw.io lightbox
Level 1: For technical stakeholders
Level 1 diagrams contain some technical details and are aimed at stakeholders who are somewhat involved in the broader technical decisions - product managers, enterprise architects, use case owners and project managers.
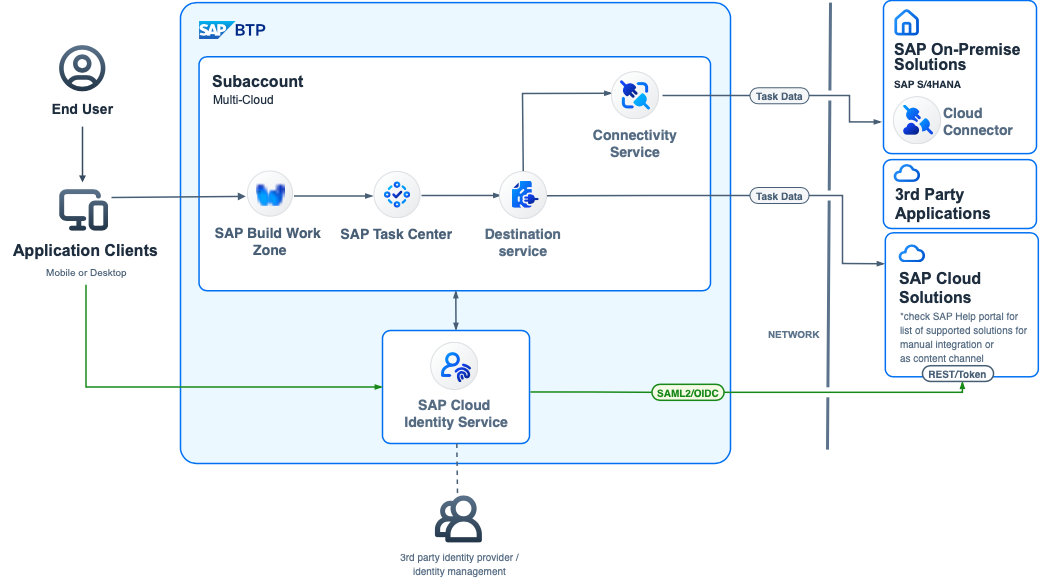
Open this example in the draw.io lightbox
Different colours in diagrams of this level generally indicate different flows, and numbers may be used to show a path or sequence.
Level 2: Architecture technical details
These diagrams are aimed at those who need to know the technical details - cloud and solution architects, technical pre-sales, and product managers.
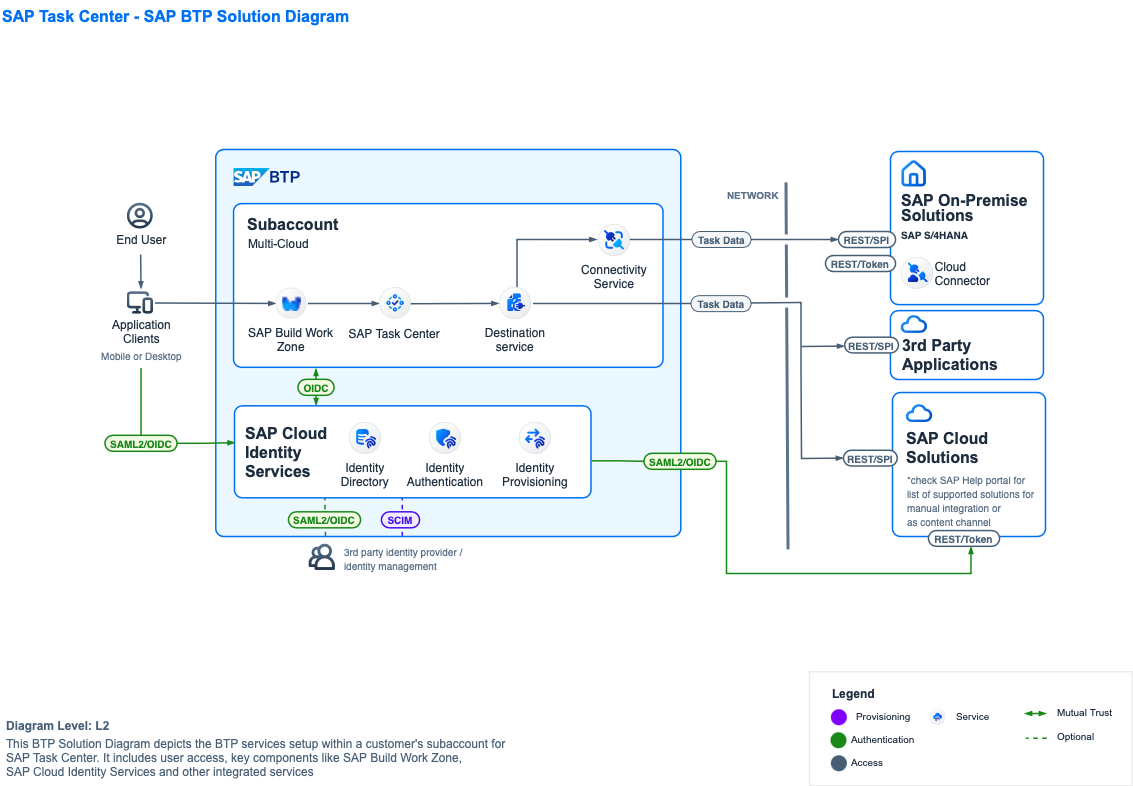
Open this example in the draw.io lightbox
BTP solution diagrams at level 2 will commonly document technical specifics such as certificates, certificate authorities, identities, API calls, firewalls, protocols, and so on.
To document implementation or process flow details in full, use the more detailed types of diagrams as described below, in addition to one or more BTP solution diagrams.
See the SAP btp-solution-diagrams repository on GitHub for more editable examples.
More detailed SAP diagrams
As well as using the new library for BTP Solution diagrams, engineers and business architects should visualise their systems and processes comprehensively using business process models (workflows), data flows, and value flows using the existing standards and built-in shapes in draw.io.
-
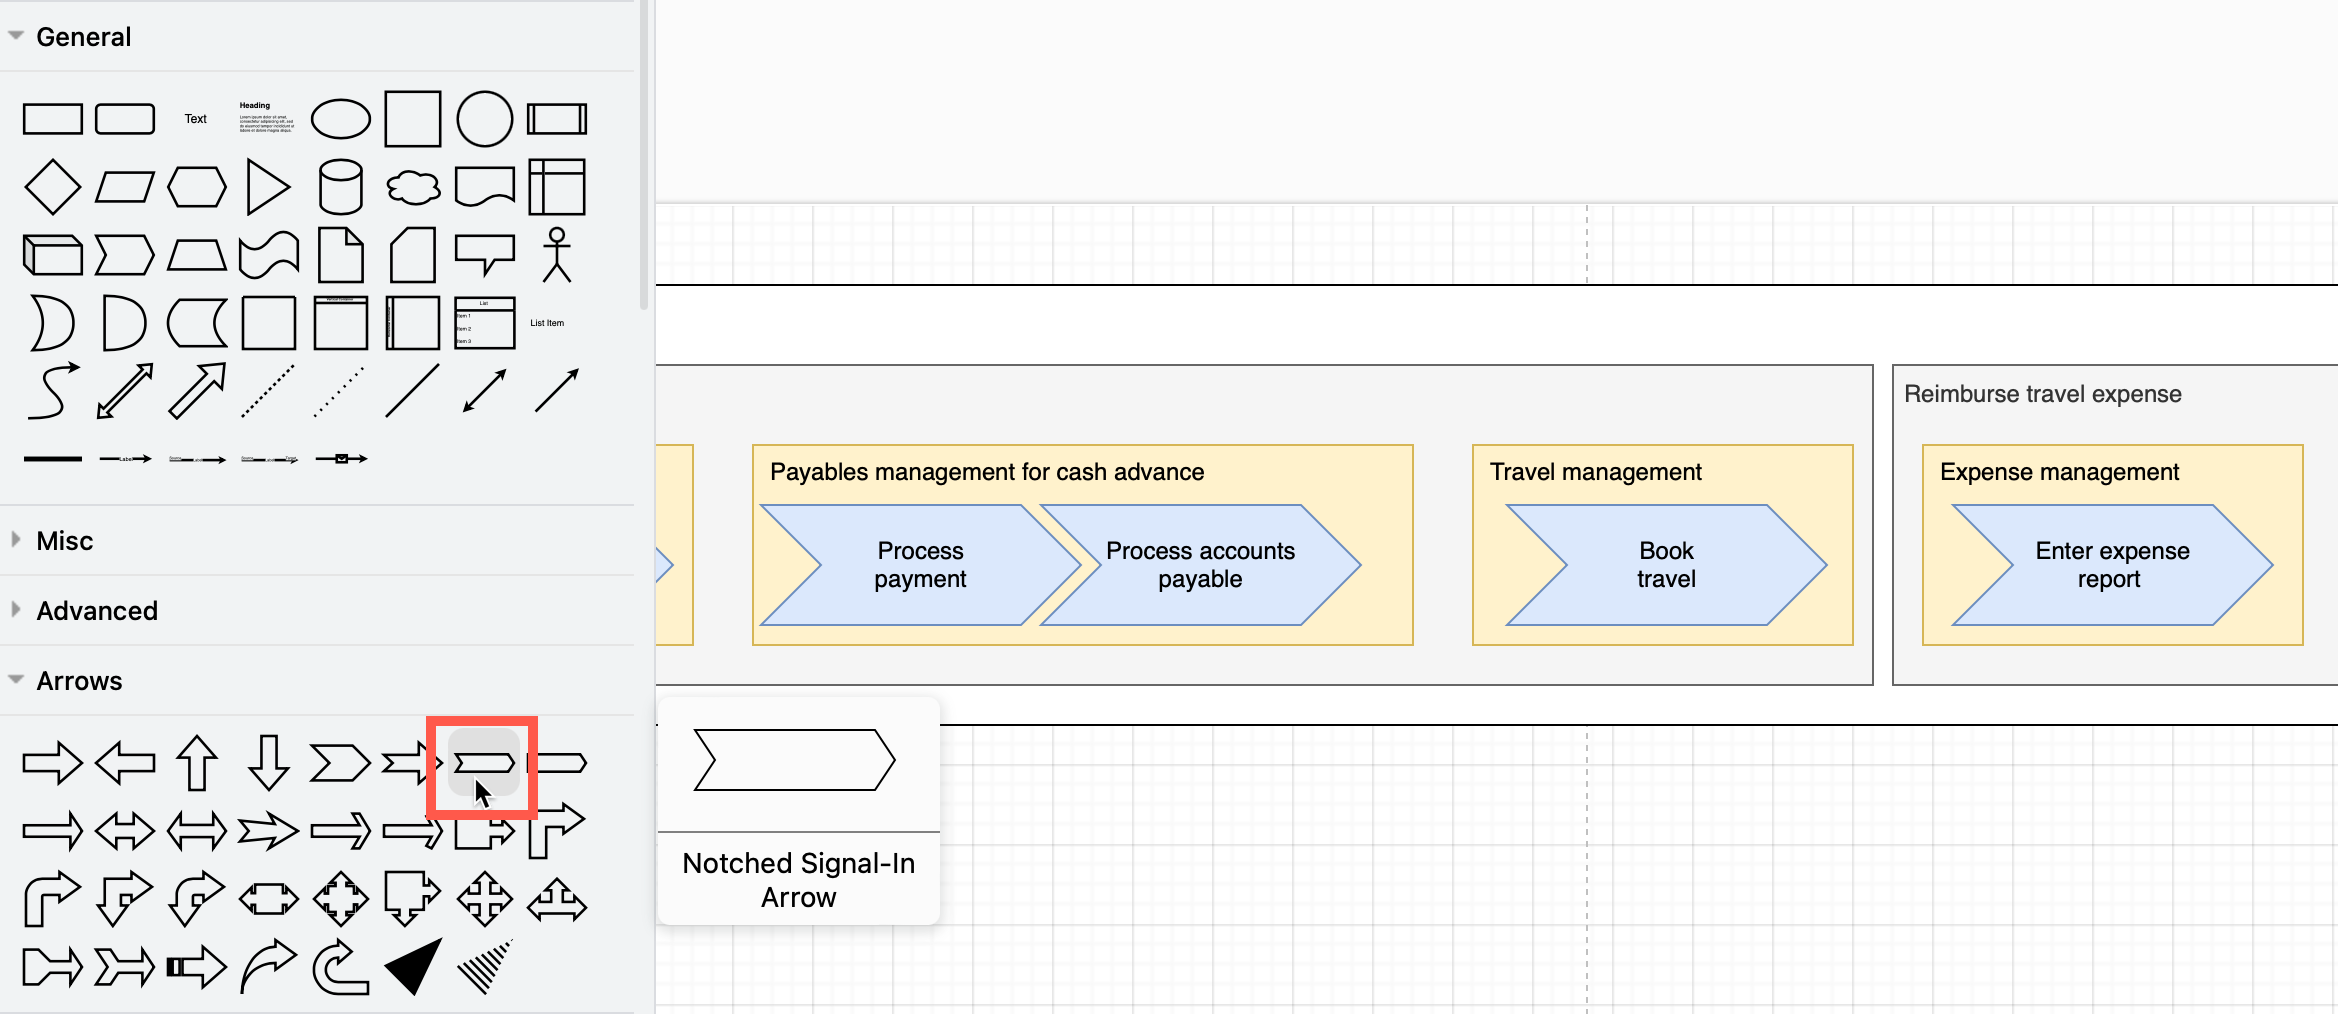
Use arrows from the Arrow shape library to draw business and solution value flows.
-
Use a collapsible tree node shape or the Tree container or Org chart shape (all in the Advanced shape library), to draw a process hierarchy. Link each node (process) to another diagram page containing the more detailed process flow to keep all related process documentation in one place.
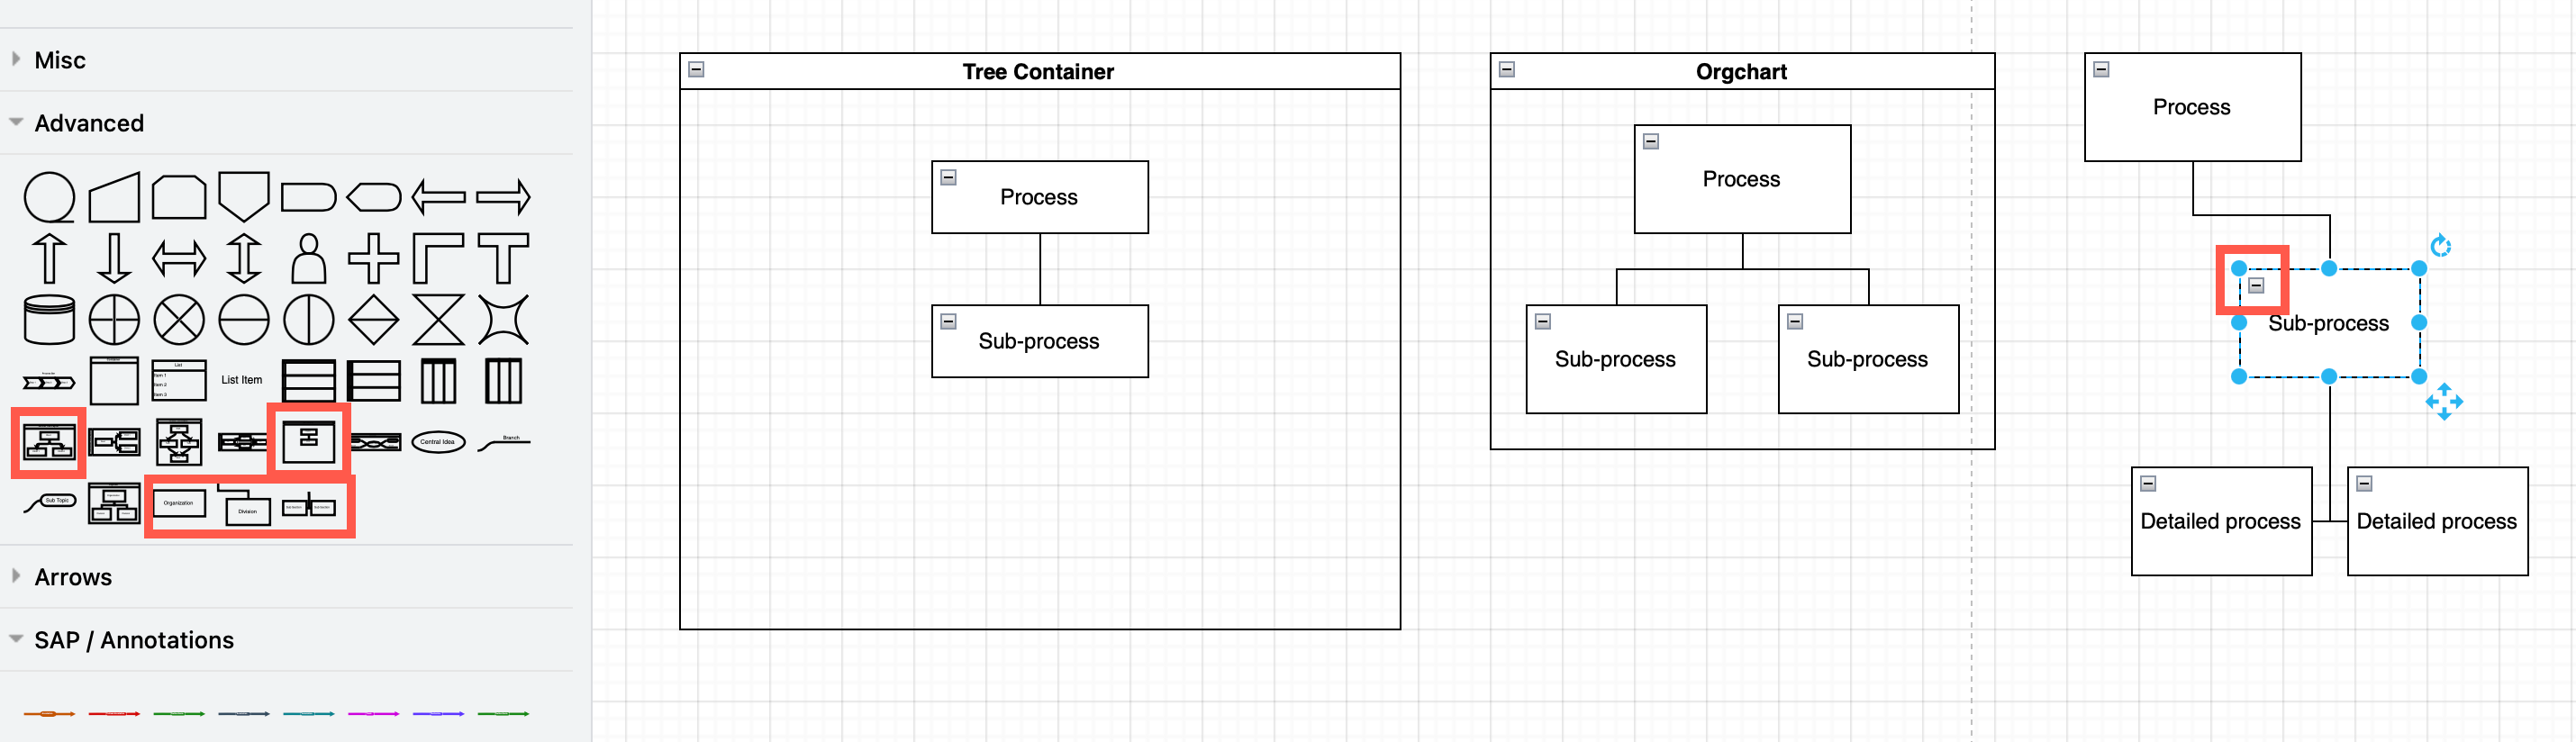
Tip: Click on the little -/+ icon in the top left of these shapes to collapse/expand them along with their sub-processes. -
Use the BPMN shape library to document process models and workflows.

-
Use a combination of UML shapes and the basic shapes from the General shape library to draw component/block diagrams, activity diagrams, state machine diagrams, sequence diagrams and class diagrams. Alternatively, Search for the shape or icon you need - e.g.
component.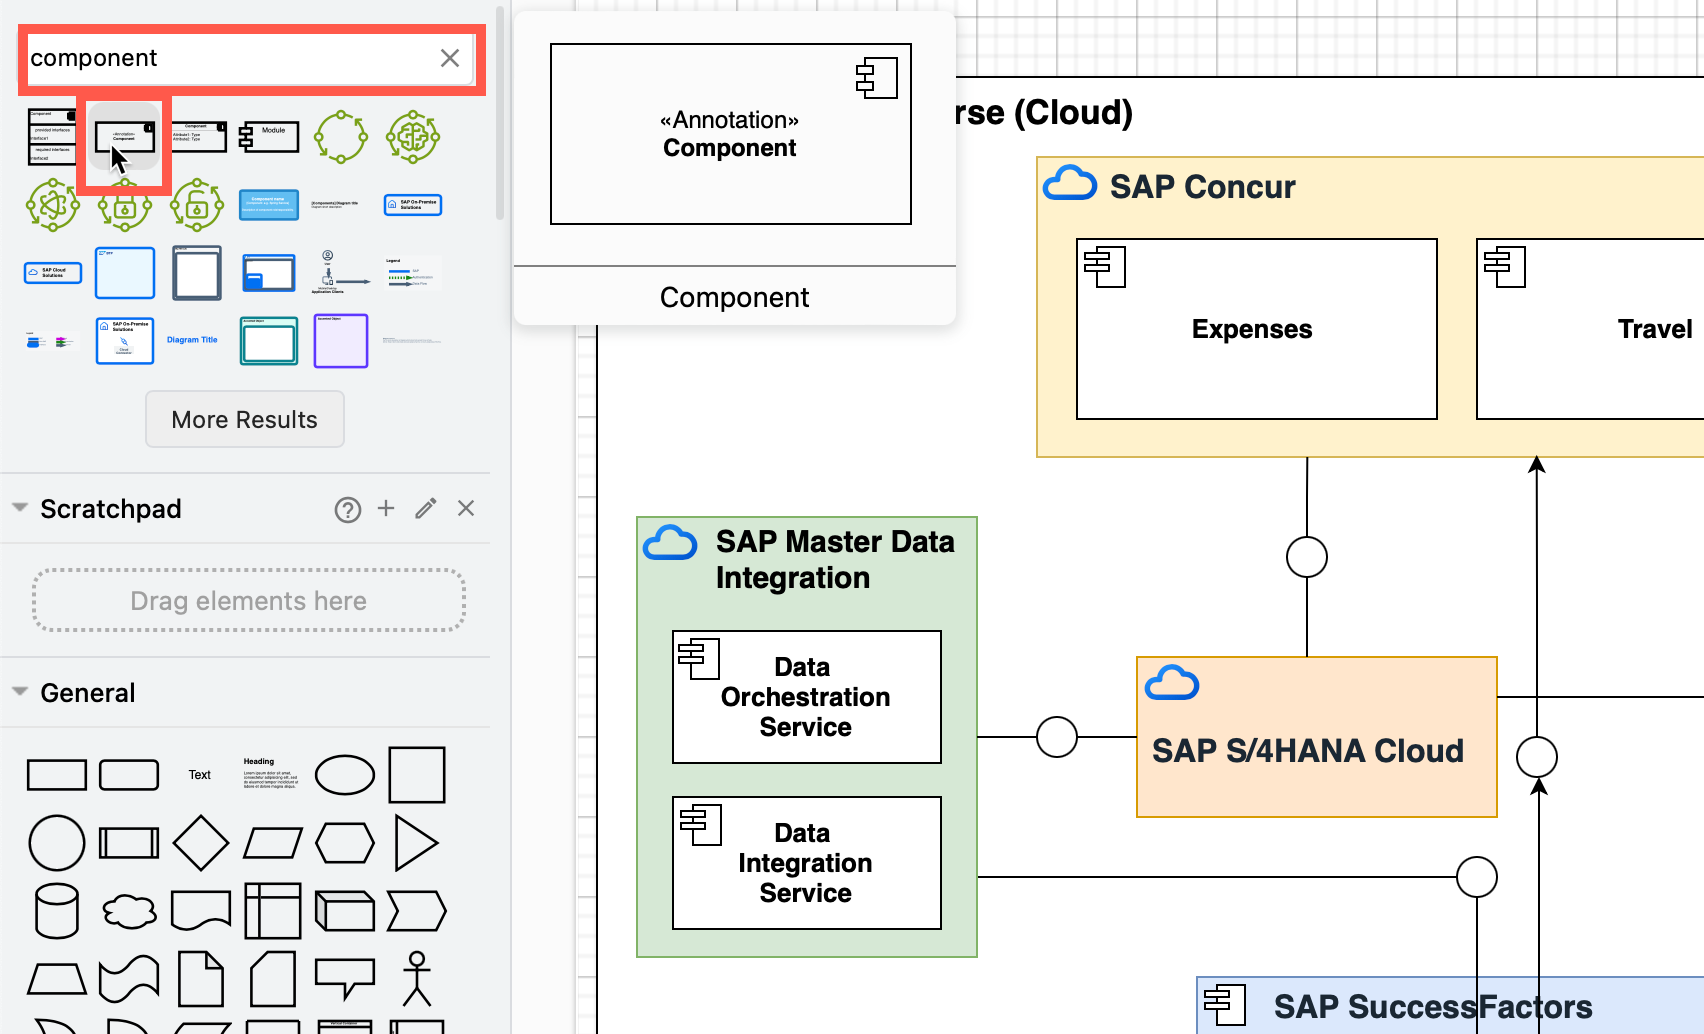
SAP recommends using their TAM notation, which combines UML and FMC. To do this, drag the little icons in the top right of UML shapes in draw.io to the left of the rectangle shape.
For more information, refer to the SAP Enterprise Architecture Methodology Guide.