Timing diagrams for UML and embedded systems
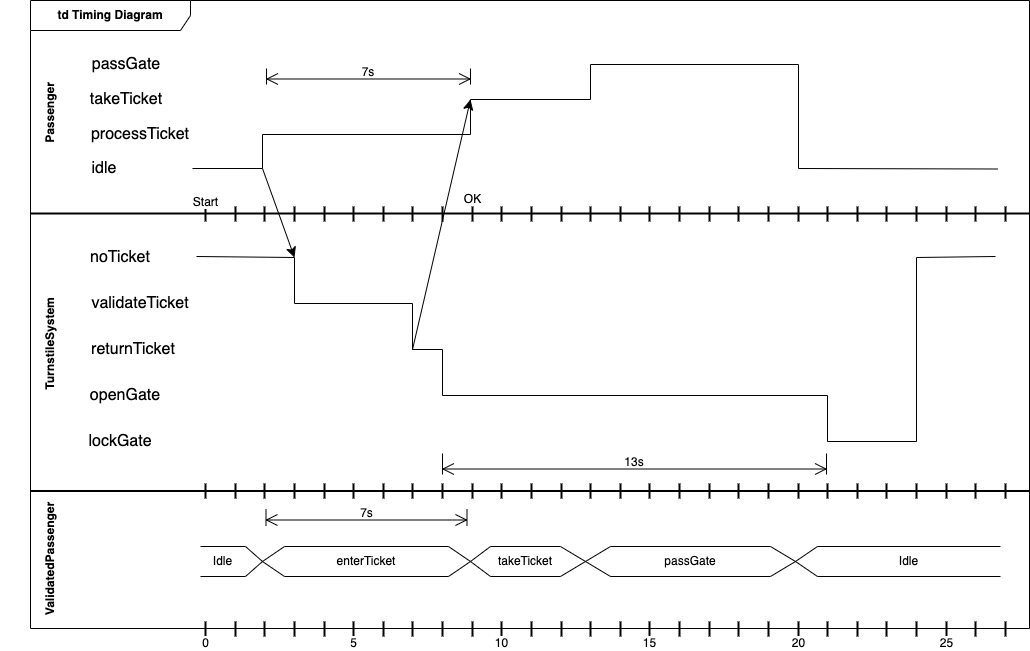
Timing diagrams are important for activities that need to be completed within a specific time frame. Such as the ringing of a doorbell after pressing a button, or a ticket gate opening after a ticket has been validated.
While you can show these constraints in other diagrams, timing diagrams can visualise more clearly the time limits on activities, their triggers, and when their state changes occur.
Timing diagrams can be used to document compliance with safety or service regulations where reaction times are important, and to analyse the performance of existing systems.
Timing diagrams in draw.io
While timing diagrams are usually mocked up in other tools, you can also create them easily in draw.io, with a few helpful layout features.
The shapes you need are relatively simple:
- diagram or frame shape from the UML shape library
- horizontal line to separate sections inside the frame shape.
- vertical line to create the scale at the bottom of the frame.
- waypoint shape to join connectors for both the state and value lifelines.
- partial rectangle for the actions in the value lifeline.
- horizontal dimension shape to specify timing constraints.
- text shapes for the actions and states on the left of the timing diagram.
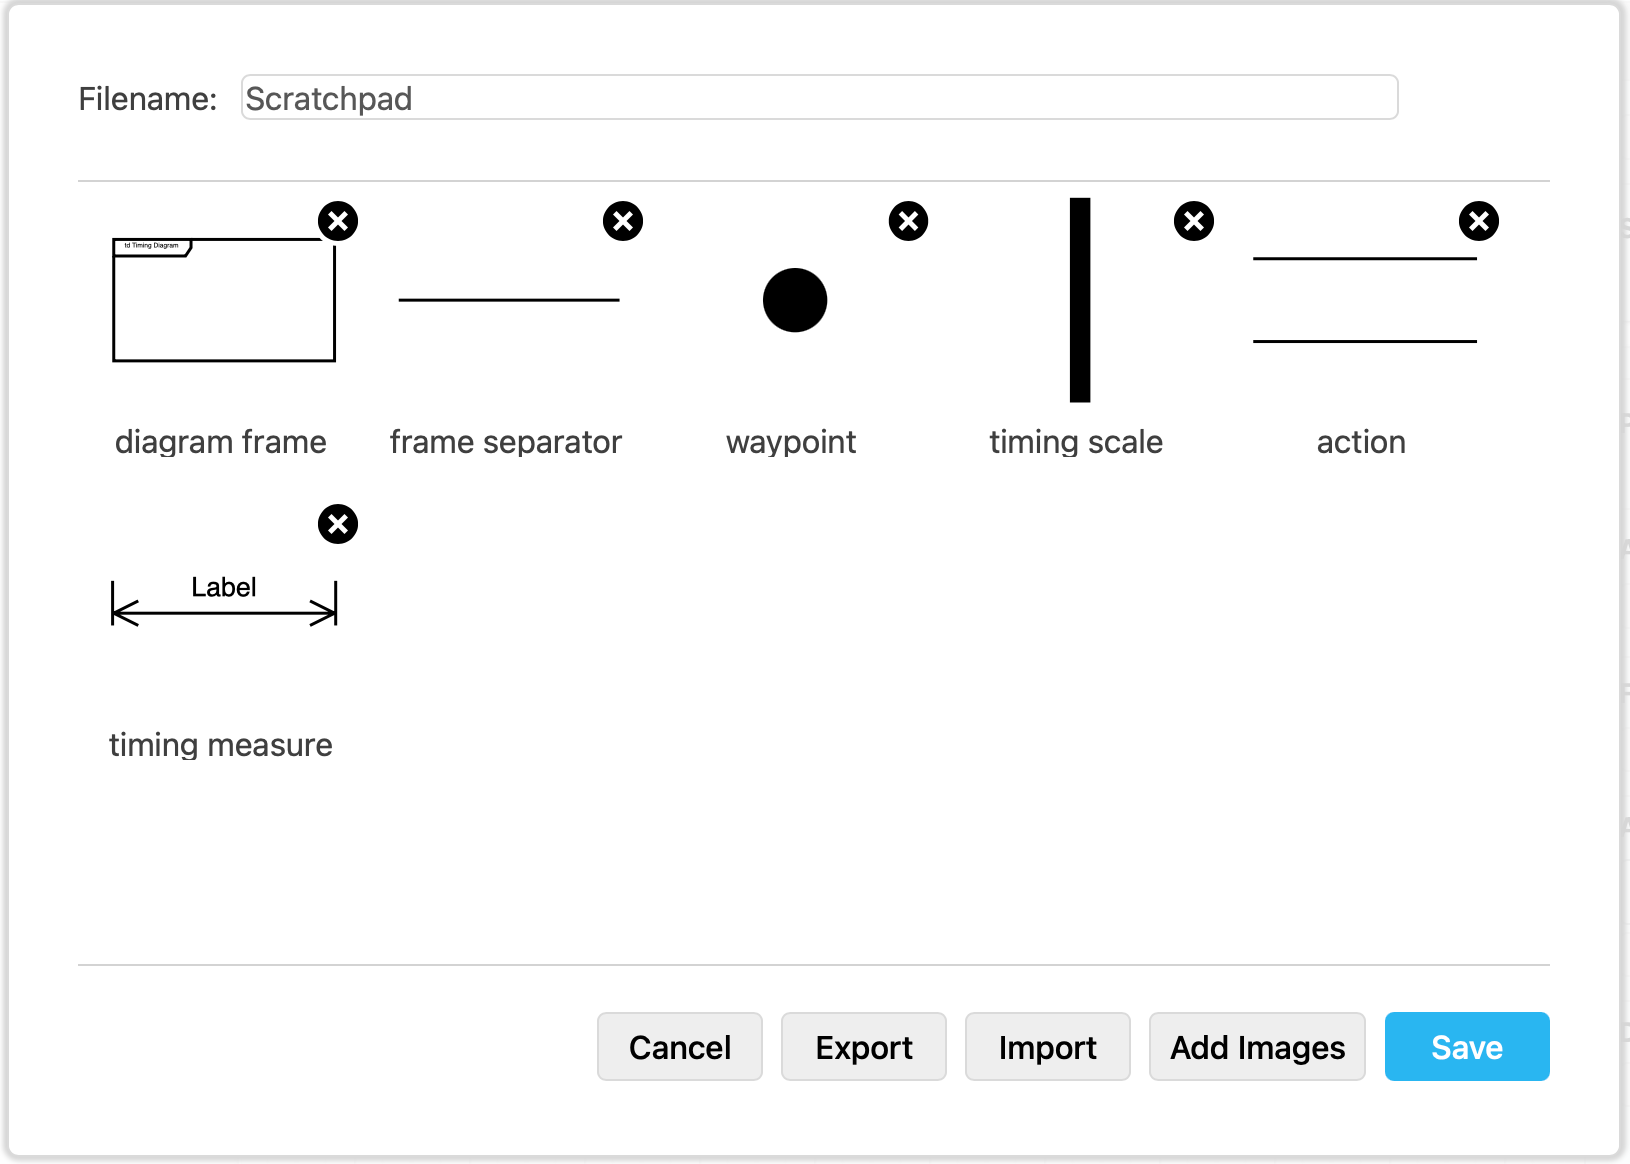
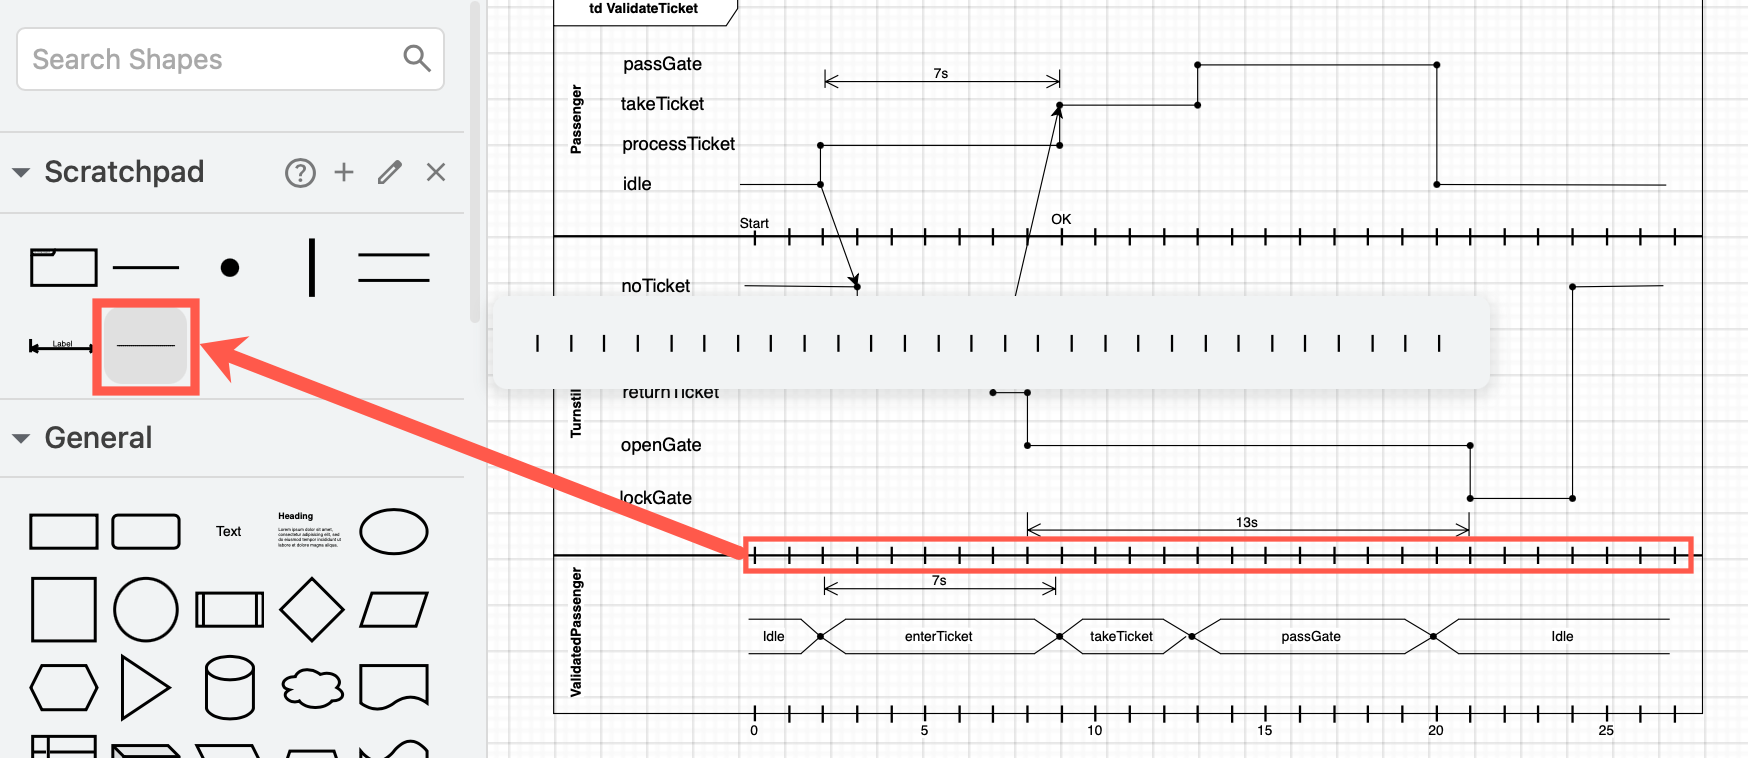
Tip: Drag one of each of these shapes from their shape libraries onto the drawing canvas before you start, then back onto the Scratchpad in the shapes panel. Now you have a quick custom timing diagram shape library in the scratchpad.
See how to use the scratchpad to speed up diagramming
Draw a custom scale
While there are ruler shapes in draw.io, they are inside a rectangular outline. You can quickly make your own scale though.
- Add a small vertical line (from Misc shape library), resize it, and place it over the bottom of the frame shape at the start of the scale.
- Copy and paste this small vertical line and move it to the end of the scale.
- Copy and paste as many vertical lines as you need to fill in the scale, placing them roughly between the start and end shapes.
- Drag a selection box around all the vertical lines.
- Go to the Arrange tab of the format panel, click on Align - Middle and then on Horizontal to Distribute the vertical lines evenly along the scale.
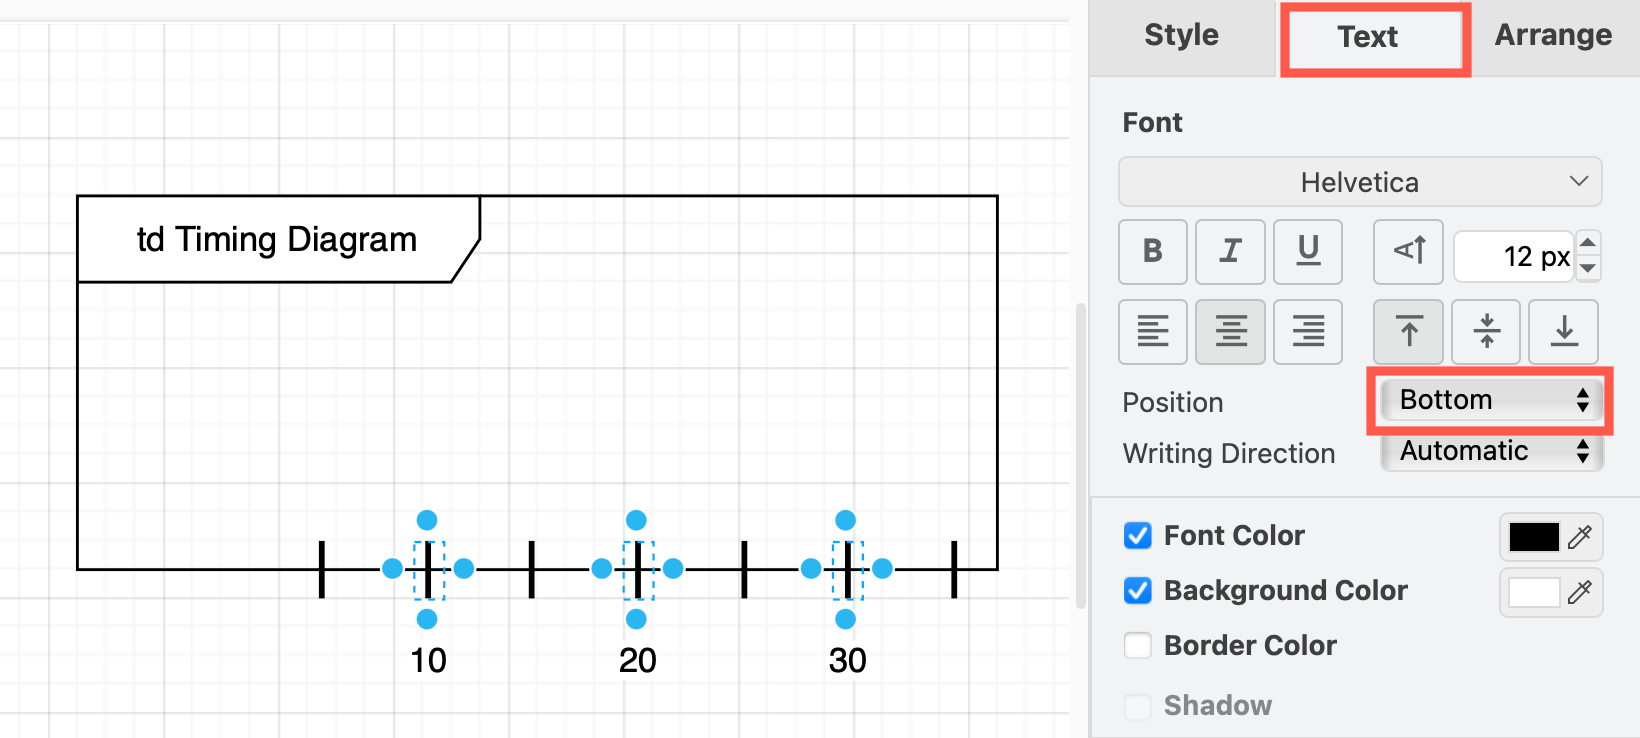
Scale labels: Add labels to the lines in the scale. Select the Bottom from the Position list in the Text tab to reposition the labels under the scale.
If you have multiple sections in your timing diagram that use the scale, select all the vertical lines before you add any labels, and group them together. Now you can copy and reposition that group over another section or add it to the scratchpad.
Waypoints and connectors for timing lines
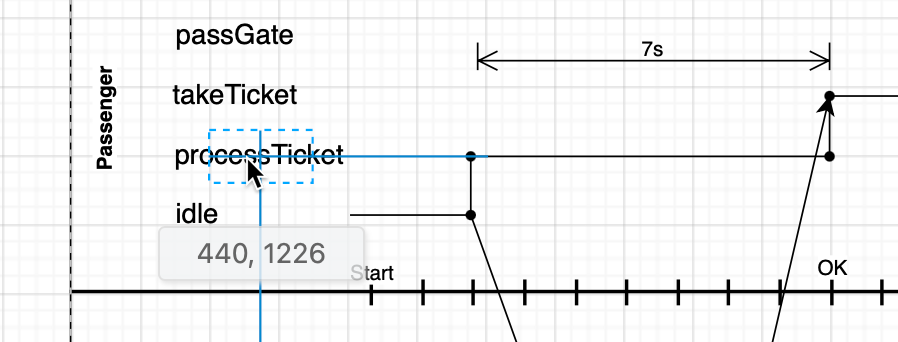
Now that you have your scale in the correct position, you can use the guidelines that appear as you drag shapes onto the canvas to position your waypoint shapes.
- Drag at least two waypoint shapes into position in your timing diagram.
- Hover over one waypoint shape and drag a connector from the direction arrows. Drop this onto the next waypoint shape in the timing diagram.
- Change the connector to have no arrows at either end, and set it to be a straight line. While it is still selected, click Set as Default Style.
- Continue attaching connectors between waypoint shapes until your state timeline is complete.
Action triggers: If you have drawn two related state lifelines, use connectors with an arrow at one end to show where an action in one lifeline triggers a state change in the other.
Action labels: Use the text shape in the General shape library to add labels to the different states. Use the blue guidelines to align the labels with their waypoint shapes.
Draw a value lifeline
While value lifelines are less common, they are used to clearly visualise the action steps and timing constraints for important use cases.
Note that they do not need to line up with the timing diagrams exactly. If there is a constraint specified with a horizontal dimension shape, it is best to ensure at least these actions line up.
- Add and resize partial rectangle shapes for each action in the use case.
- Use the Middle alignment in the Arrange tab of the format panel to ensure they are at the same height.
- Add waypoint shapes between each action and align them evenly.
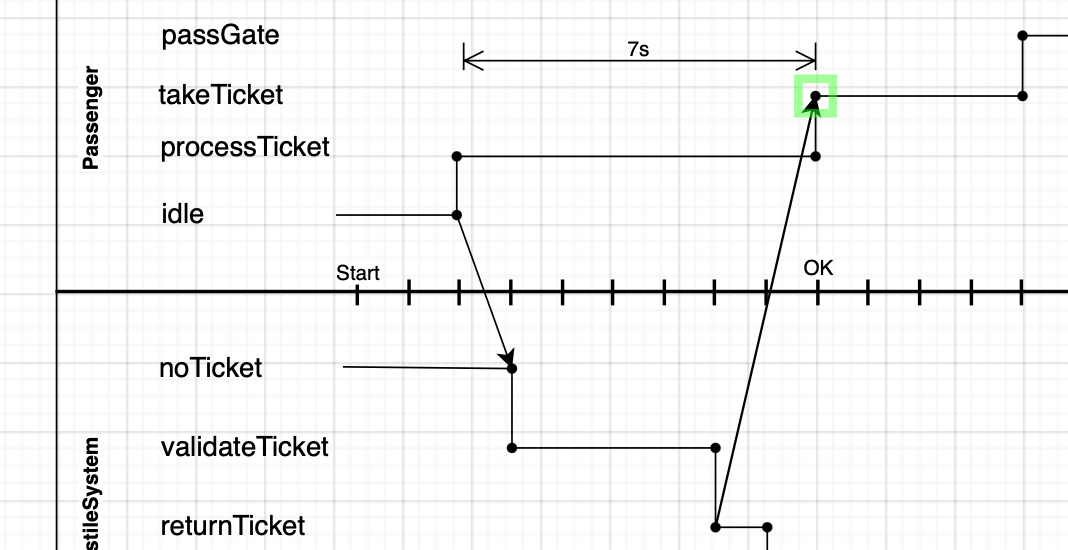
- Drag connectors (with no arrows) from the top right and bottom right corner of one partial rectangle to the waypoint.
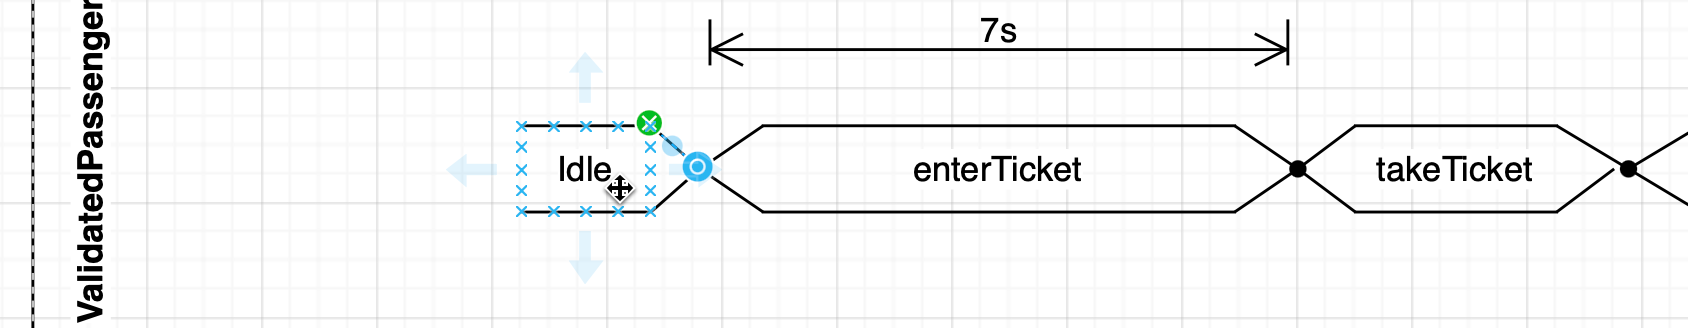
Make sure you attach them as fixed connectors to the fixed connection points on the partial rectangles (the green cross above). You can also customise the connection points on the partial rectangle shape. - Drag connectors from the waypoint shape to the top and bottom left connection points of the next action.
- Repeat until you have drawn the full value lifeline.
Tip: While could use an ‘x’ shape to avoid the extra steps using connectors and waypoint shapes, but the partial rectangle makes it easier to add labels, resize actions and move them around.
Simplify the timing diagram
You can make the waypoint shapes invisible when you have finished your diagram - select all the waypoint shapes and deselect Line in the Style tab of the format panel. Now, your timing diagram will look less cluttered.
Open this timing diagram example in the draw.io viewer
More UML diagrams
Timing diagrams are also part of the UML specification. There are many different types of UML diagrams that allow you to model the behaviour and data of systems and processes both as abstract overviews and in detail for accurate implementations.

Refer to the UML diagram overview post for the many other types of UML diagrams.