UML overview - where and why each UML diagram is used
UML notation is one of the most popular technical diagramming standards defining a wide range of diagrams useful in many different industries and professions, not just software engineering. That many different technical diagrams can be daunting, so here is an overview of each of the different types of UML diagrams, who draws or reads them, and why they are useful.
UML diagrams visualise complex systems and processes in a way that is easy to understand. These diagrams can be used to implement systems faster and more accurately, to reduce implementation errors in large team projects, and test existing systems and processes to ensure they are working as intended and as documented.
Professions that draw or read UML diagrams include software development, IT services, system architects, business analysts, quality assurance, corporate finance, HR and OHS, security analysts and auditors, web service and app development, and many related fields.
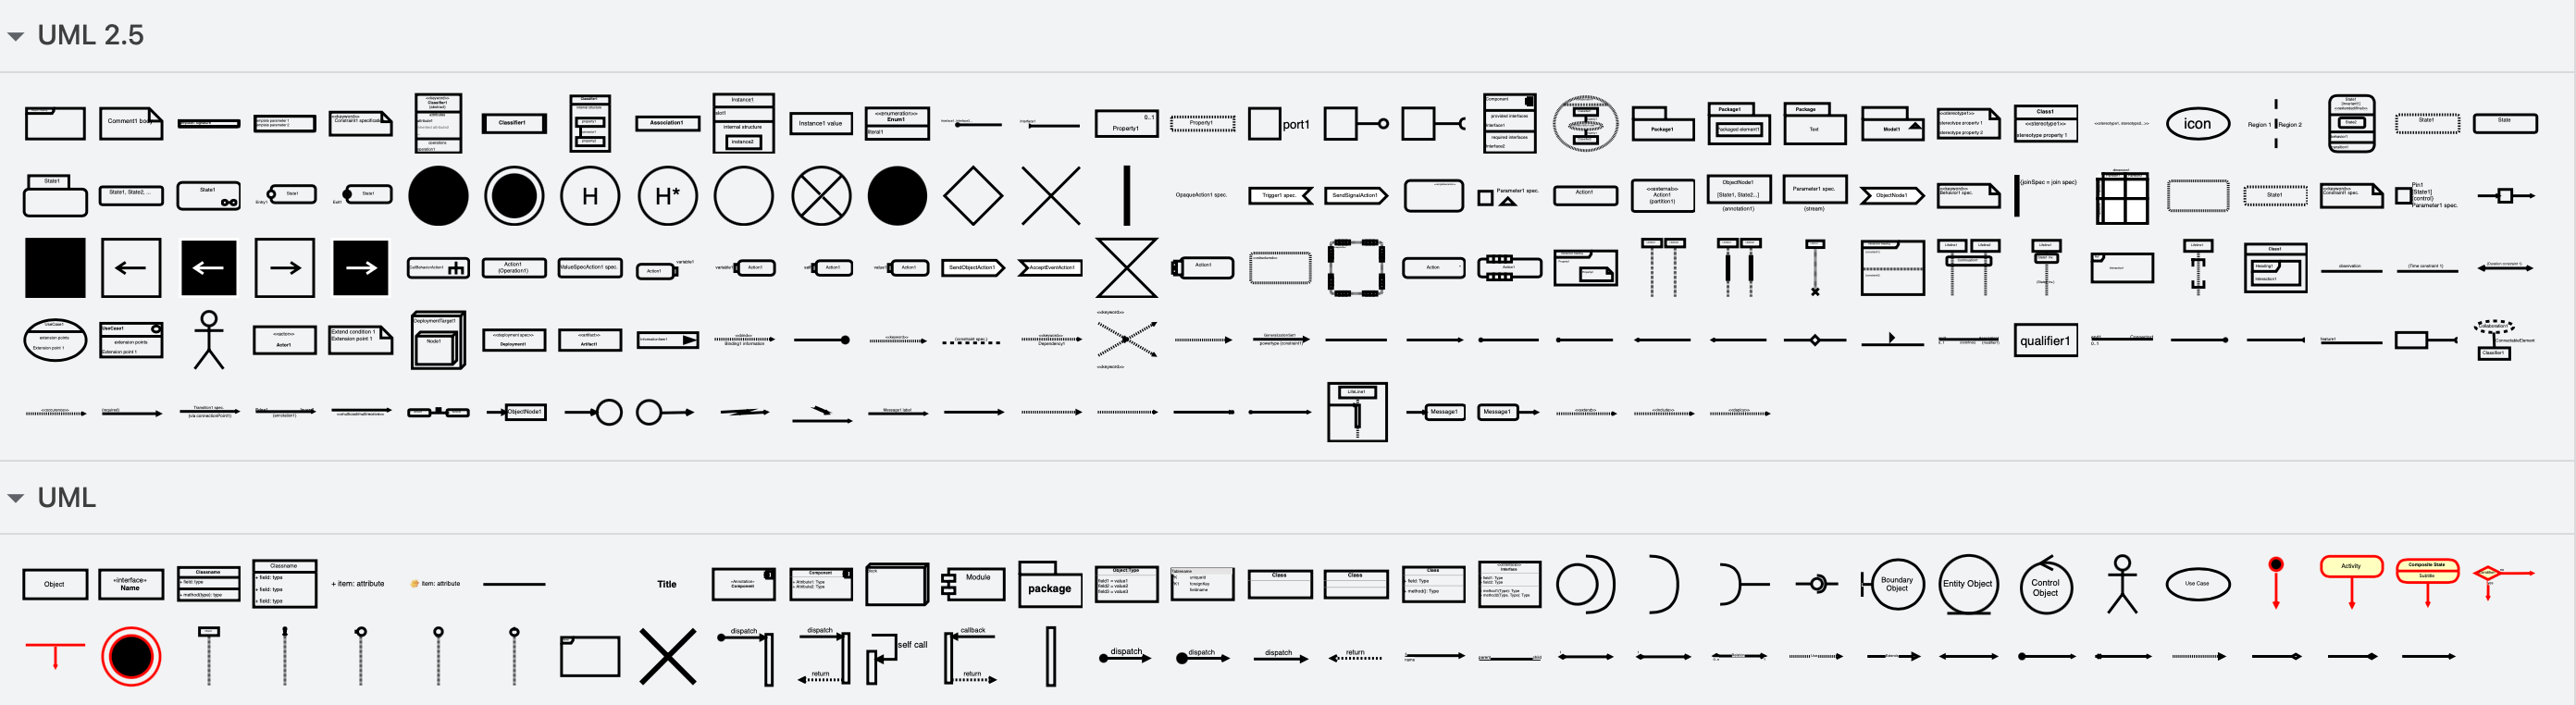
UML shapes in draw.io: Click More Shapes in the left shapes panel and enable the UML and UML 2.5 shape libraries, along with the General shape library. Alternatively, search for a shape using its name as defined in the UML standard.
List of UML diagrams
Jump to a specific UML diagram type using the links below.
The UML standard (updated to 2.5.1 in 2017) defines 14 different diagram types, organised into two distinct groups.

Structure diagrams: show the static structure of a system or process to document how each part of the system relates to the others.
Behaviour diagrams: show how control passes, or information is passed between elements of the system as it runs.
You may come across another of eight more specialised UML diagram types that are used for certain applications. While they are not defined in the standard, they can be useful in certain situations.
Each of the main UML diagram types is briefly described below, noting who needs to draw and read them, whether they can be feasibly AI generated, and why they are useful. For more information, see the linked tutorials and examples.
UML structure diagrams
A system’s structure is drawn in UML structure diagrams at various levels of detail - from a top-level abstract design through to its real-world implementation. As this diagram group shows the static structure, they do not model the behaviour of a running system, how it changes over time, or how it interacts with other systems in use.
UML class diagrams
Shows: Data or attributes within each ‘class’, the methods (operations or functions) that each class provides. Class diagrams show the relationships between the classes (inheritance, dependencies, associations, etc.) via specific connector arrows.
Used for: To define clearly how your system should be implemented in code. May use a specific programming language or instead specify the concepts for implementation. An abstract overview class diagram with no or minimal implementation details is useful for ideation and to achieve top-level stakeholder agreement.
Professions/fields: Software development, IT, system architects
AI generation? Yes. Brainstorm potential classes to see suggested data and functions that could be useful in a new system. Not feasible when are adding to or modifying an existing system.
See how to draw a class diagram in draw.io

Related diagrams: Related to class diagrams, information flow diagrams show how data is passed between the elements of a system at a high level of abstraction. While not defined in UML 2.5, these diagrams can describe how parts of the system are implemented to ensure that the right information moves correctly and securely between system elements. Class diagrams are similar to entity relationship diagrams which are used for database development.
UML object diagrams
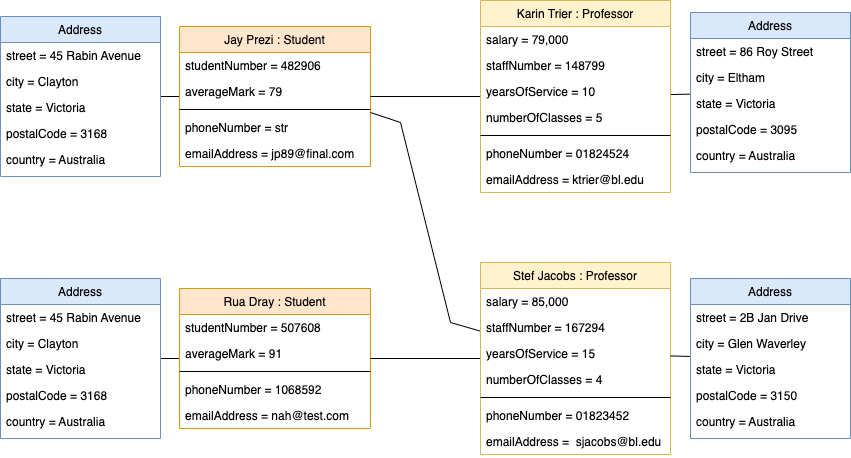
Shows: Named instances of classes and interfaces (objects) showing actual attribute values and links to other objects or systems.
Used for: To provide a snapshot example of the values and relationships a system should have at a specific moment in time. Useful when testing a system to ensure it performs as expected and as designed.
Professions/fields: Software development, IT, quality assurance
AI generation? Not viable as the generator can’t guess sensible values for the attributes of a system.
UML package diagrams
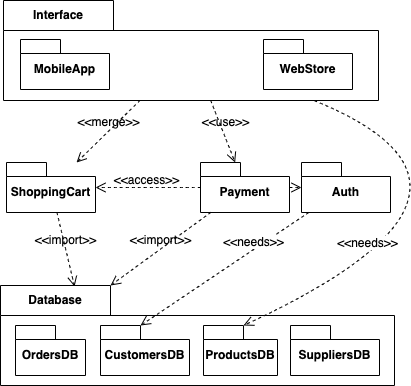
In medium to large software projects, it is common to use modules or ‘packages’ of third-party code to provide specific functions or fulfil certain roles, rather than developing everything in-house. You can also package your own related system functions together for reuse in another project.
Shows: A high-level overview of the structure of a system broken into packages, including what each package is dependent on how they interact with other packages.
Used for: To break a system into logical packages where various alternatives, often provided by third parties, can be substituted to evaluate and optimise a system.
Professions/fields: Business analysts, software engineering, IT, system architects
AI generation? Maybe. As this is similar to an abstract class diagram with no implementation details, you could brainstorm different package groupings, providing the generator was aware of what functionality can be sensibly grouped together.
Related diagrams: As a more abstract type of package diagrams, model diagrams show an even broader view of the structure of a system, often to visualise how multi-layered application is logically organised.
UML composite structure diagrams
Shows: The details of interconnected elements of an object that work together when the system runs. This is the internal structure of a class and how it collaborates through ports with different parts (roles) in the system as well as with external elements.
Used for: To visualise the system from each object’s point of view. This is useful when different teams are developing separate objects or aspects of a physical or digital product that must eventually fit and work together.
Professions/fields: Software development, manufacturing and product design, system architects
AI generation? Not feasible as these diagrams show the detailed internal structure of your system.

Related diagrams: You can show specifics of the structure of a system in various ways: internal structure diagrams document the properties, parts and relationships of one or more classifiers in a system, while collaboration use diagrams show how certain parts of a system cooperate to realise a specific behaviour.
UML component diagrams
Shows: Dependencies between the logical and physical components of a system, including the interfaces that each component requires and provides.
Used for: Defining components and their interfaces early in a project ensures all stakeholders can agree on implementation details before coding begins.
Professions/fields: Software development, IT, system architects
AI generation? Not viable as components and their interface “ports” are highly specific to each system.
See how to draw a component diagram in draw.io

Related diagrams: The detailed internal structure of artifacts that work together to realise elements of system are shown in manifestation diagrams. However, this is usually documented in component and deployment diagrams, unless the separation of this detail is critical for the documentation or implementation of a system.
UML deployment diagrams
Shows: The physical and digital structure of a running system - which artifacts are deployed where, and how they communicate. Deployment diagrams include both hardware and software components, deployment relationships, and name the protocols used when two elements communicate.
Used for: To visualise distributed systems with multiple servers and multiple versions of artifacts, to show how hardware is controlled by external triggers, to show the structure of embedded systems, to check robustness and redundancy in case of failure, to analyse resource requirements, to optimise the distribution of artifacts across hardware components, and to check that a system is designed to meet security requirements.
Professions/fields: System architects, software and app developers, IT and IT services, cybersecurity
AI generation? Not feasible as you need to include the names of the actual devices, protocols, code modules and packages in your system.

Related diagrams: Infrastructure is documented in a network architecture diagram to show either the logical or the physical architecture of the system. As this diagram type is not defined by the UML 2.5 standard, you would usually use the shapes of the cloud platform or service provider and draw a typical network diagram.
UML profile diagrams
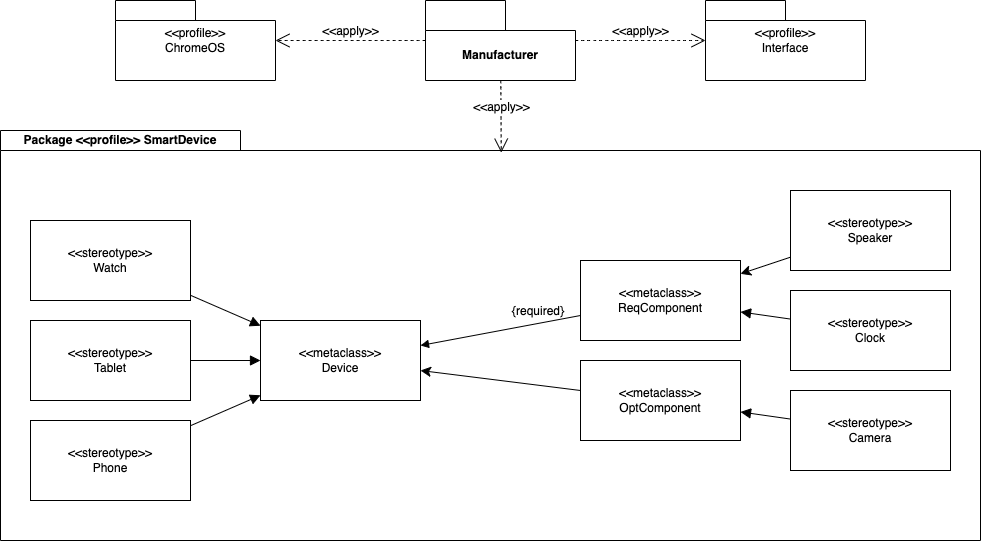
Shows: A metamodel, or a model of a model, where a system could be implemented in many different domains. Profile diagrams use metaclasses and stereotypes to extend the UML model of a system to show customised applications using different frameworks, implementation languages, protocols, and constraints, or to show additional contextual information. Profile diagrams and shapes are used as components in other UML diagrams, particularly in class and package diagrams (example below).
Used for: To add context to high level diagrams to allow for the easier reuse and specialisation of system components. Profile diagrams may also be used to show ownership and responsibility, management or configuration options.
Professions/fields: Software development, system architects
AI generation? Not feasible. Profile diagrams are created once a system has been designed for one specific domain, then extend the model to be applied in a different domain.
UML behaviour diagrams
A system’s dynamic behaviour is visualised in behaviour diagrams, including its processes, the interactions between each part of that system and with external systems, and how the state of elements within that system change as the system runs. While some of these diagrams show a high-level concept of how a system could be implemented (use case diagrams), others are more detailed, describing the low-level specifics (interaction diagrams, state machine diagrams).
UML use case diagrams
Shows: Every way an end-user can interact with your systems, with all its pre- and post-conditions, exceptions and alternate paths.
Used for: To define your system’s requirements, both digital and analog, to detail how your system should be used and how it should interact with connected systems. Use case diagrams are one of the foundations of the technical documentation for your system or process.
Professions/fields: Business analysts, software development, IT, retail and customer service, marketing and product design, quality assurance, web and app development, system architects
AI generation? Yes. Brainstorm a variety of use cases for your system - you may find ones you had not considered.
See how to draw a use case diagram in draw.io

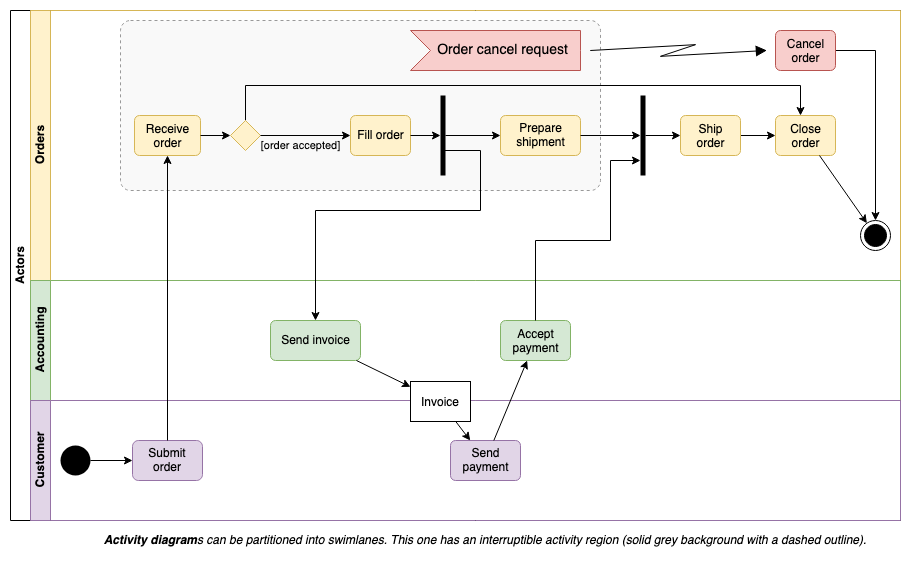
UML activity diagrams
Shows: Describes the sequence of activities and the flow of control or flow of objects through a system to achieve a goal or complete a task (activity). May show physical and digital systems as well as business processes.
Used for: To visualise a complex workflow or use case, especially parallel tasks and decision processes. To analyse implemented systems or workflows to ensure it conforms to its design or to standards for various types of accreditations including security.
Professions/fields: Business analysts, software development, IT, quality assurance, HR, corporate finance, system architects
AI generation? Yes. Brainstorm ideas for how control flows through elements of a system as an activity is carried out.
See how to draw an activity diagram in draw.io
UML state machine diagrams
Shows: Visualises system states and the transitions (processes) that trigger another state. Used especially to document failed states and the recovery from those states in case of liability or to highlight a problem with an existing system.
Used for: To help you define, program and solve problems in complex systems with interconnected components. May be necessary for various accreditations that require documentation for backup and recovery procedures in case of incidents or accidents.
Professions/fields: Software development, IT, incident planning and disaster recovery, information and systems security, corporate finance, system architects
AI generation? Not feasible. These diagrams contain specific details about implemented systems, including triggers, actors, technologies and actions within that system.
See how to draw a state machine diagram in draw.io

There are four different sub-types of UML interaction diagrams.
UML sequence diagrams
Shows: The order of messages that are passed between elements of a system to complete a particular task or use case. Sequence diagrams model the series of events and information flows that a use case must execute.
Used for: To ensure the right information is passed to the right actors or entities at the right time. Can be used in many fields, including corporate finance and retail to ensure accounting practices and customer service procedures are efficient and correct.
Professions/fields: Software development, IT, corporate finance, retail, business analysts, incident planning and disaster management, system architects
AI generation? Yes. Brainstorm different sequences to find an efficient way to pass information through elements of a system as a use case is executed.
See how to draw a sequence diagram in draw.io

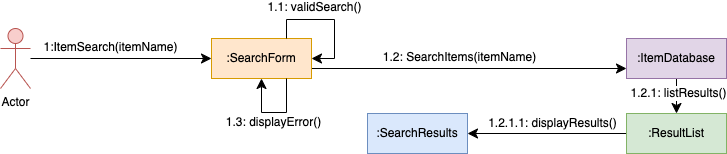
UML communication diagrams
Shows: A detailed and low-level diagram showing a numbered sequence of messages to and from a central entity to every other element of the system it interacts with to complete a task. As a simplified version of a sequence diagram, communication diagrams (formerly collaboration diagrams) highlight which system elements each element interacts with, whereas sequence diagrams show the order of messages being passed more clearly.
Used for: To troubleshoot communications problems or ensure system requirements and operations standards are met during testing or compliance audits.
Professions/fields: System architects, IT, software development, quality assurance
AI generation? Not feasible as they include specific elements of a planned or implemented system and are typically drawn after the sequence diagrams have been finalised.
See how to draw a communication diagram in draw.io
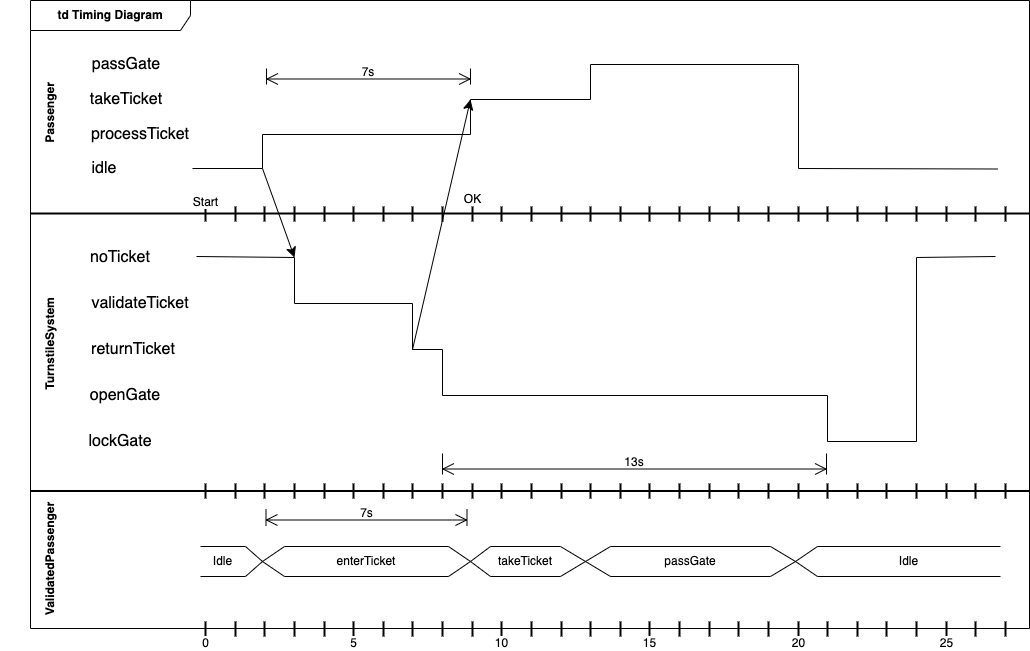
UML timing diagrams
Timing diagrams should match their related state machine diagrams and sequence diagrams.
Shows: The time required for an action to change the state (or value) of an element in a system in two ways: one or more coupled elements interacting to change states over time (a state lifeline), or how values change as time passes for one action (a value lifeline, bottom section in the example below).
Used for: To demonstrate compliance with safety or service regulations where reaction times are important, to specify timing constraints, to analyse the performance of an existing system.
Professions/fields: Software development, manufacturing, system architects, embedded systems designers, compliance auditors, incident planning and disaster management, real-time systems
AI generation? Not feasible as this diagram shows specific time constraints and the low-level details of a system.
See how to draw a timing diagram in draw.io
Tip: Use waypoint shapes at each timing point and draw connectors between them. Select all the waypoint shapes when you are finished and make them invisible by deselecting Line in the Style tab of the format panel.
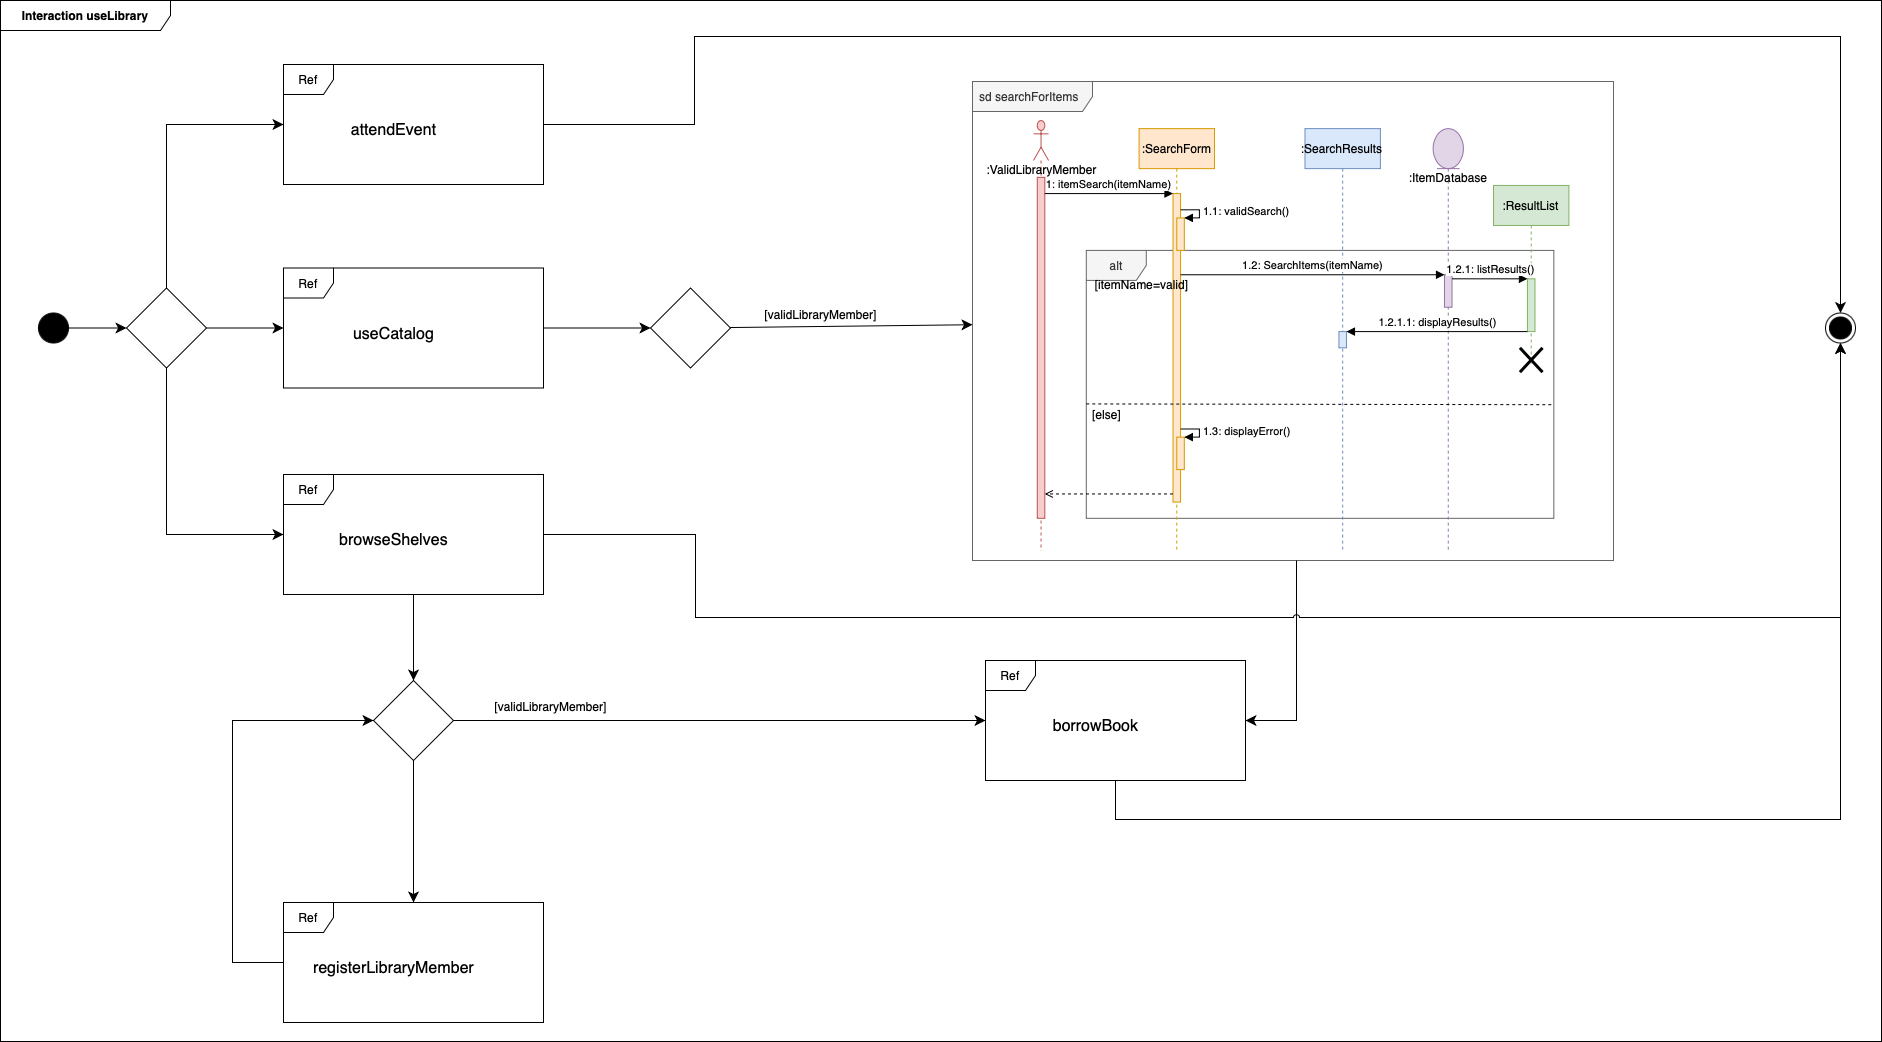
UML interaction overview diagrams
Interaction diagrams are closely related to activity and sequence diagrams.
Shows: An overview of the interactions in a system and how control flows between them. Sometimes also called interaction diagrams, simple flowchart shapes and connectors show how control flows between interactions, which may be embedded as an activity or sequence diagram (example below).
Used for: To provide an overview of interactions at this higher level for stakeholder approval, to analyse a complex systems, to show system or process dependencies, and to show where changes to the flow of control may impact the system when rolling out updates or revisions. Useful when debugging problems or optimising a large system.
Professions/fields: System architects, business analysts, software development, change management
AI generation? Not feasible. Interaction overview diagrams are typically drawn after the activity diagrams have been completed, showing how each activity interacts with each other and how control flows between them.
Tip: Use an interaction overview as the first page of your multi-page diagram in draw.io, and add a link from each interaction to the page where that activity or sequence diagram is drawn.
See how to draw interaction overview diagrams in draw.io
Are AI-generated UML diagrams viable?
AI generation may be suitable for some of the UML diagram types, especially when brainstorming new or alternative solutions and system structures - to get an idea of what is possible. The smart template tool in draw.io may suggest one or more useful solutions you had not thought of.
However, if your employment or freelance contract contains a confidentiality clause or you have signed an NDA, ensure you do not include any sensitive, identifying or otherwise confidential information into your query to the AI tool. All queries are saved by the AI generator and ingested into its training database. The smart templates feature uses ChatGPT to parse your query and generate the template.
Learn more about smart templates and how to write a good query to generate a useful diagram.
Related topics
UML is closely related to SysML, sharing many of the diagram types above with a few modifications.
Input Mermaid code to generate a UML diagram with draw.io shapes that you can style and edit as needed, including using the Mermaid ELK layout.
See what features you should look for in a UML diagramming tool to help your team collaborate quickly and securely on all types of UML diagrams.