features
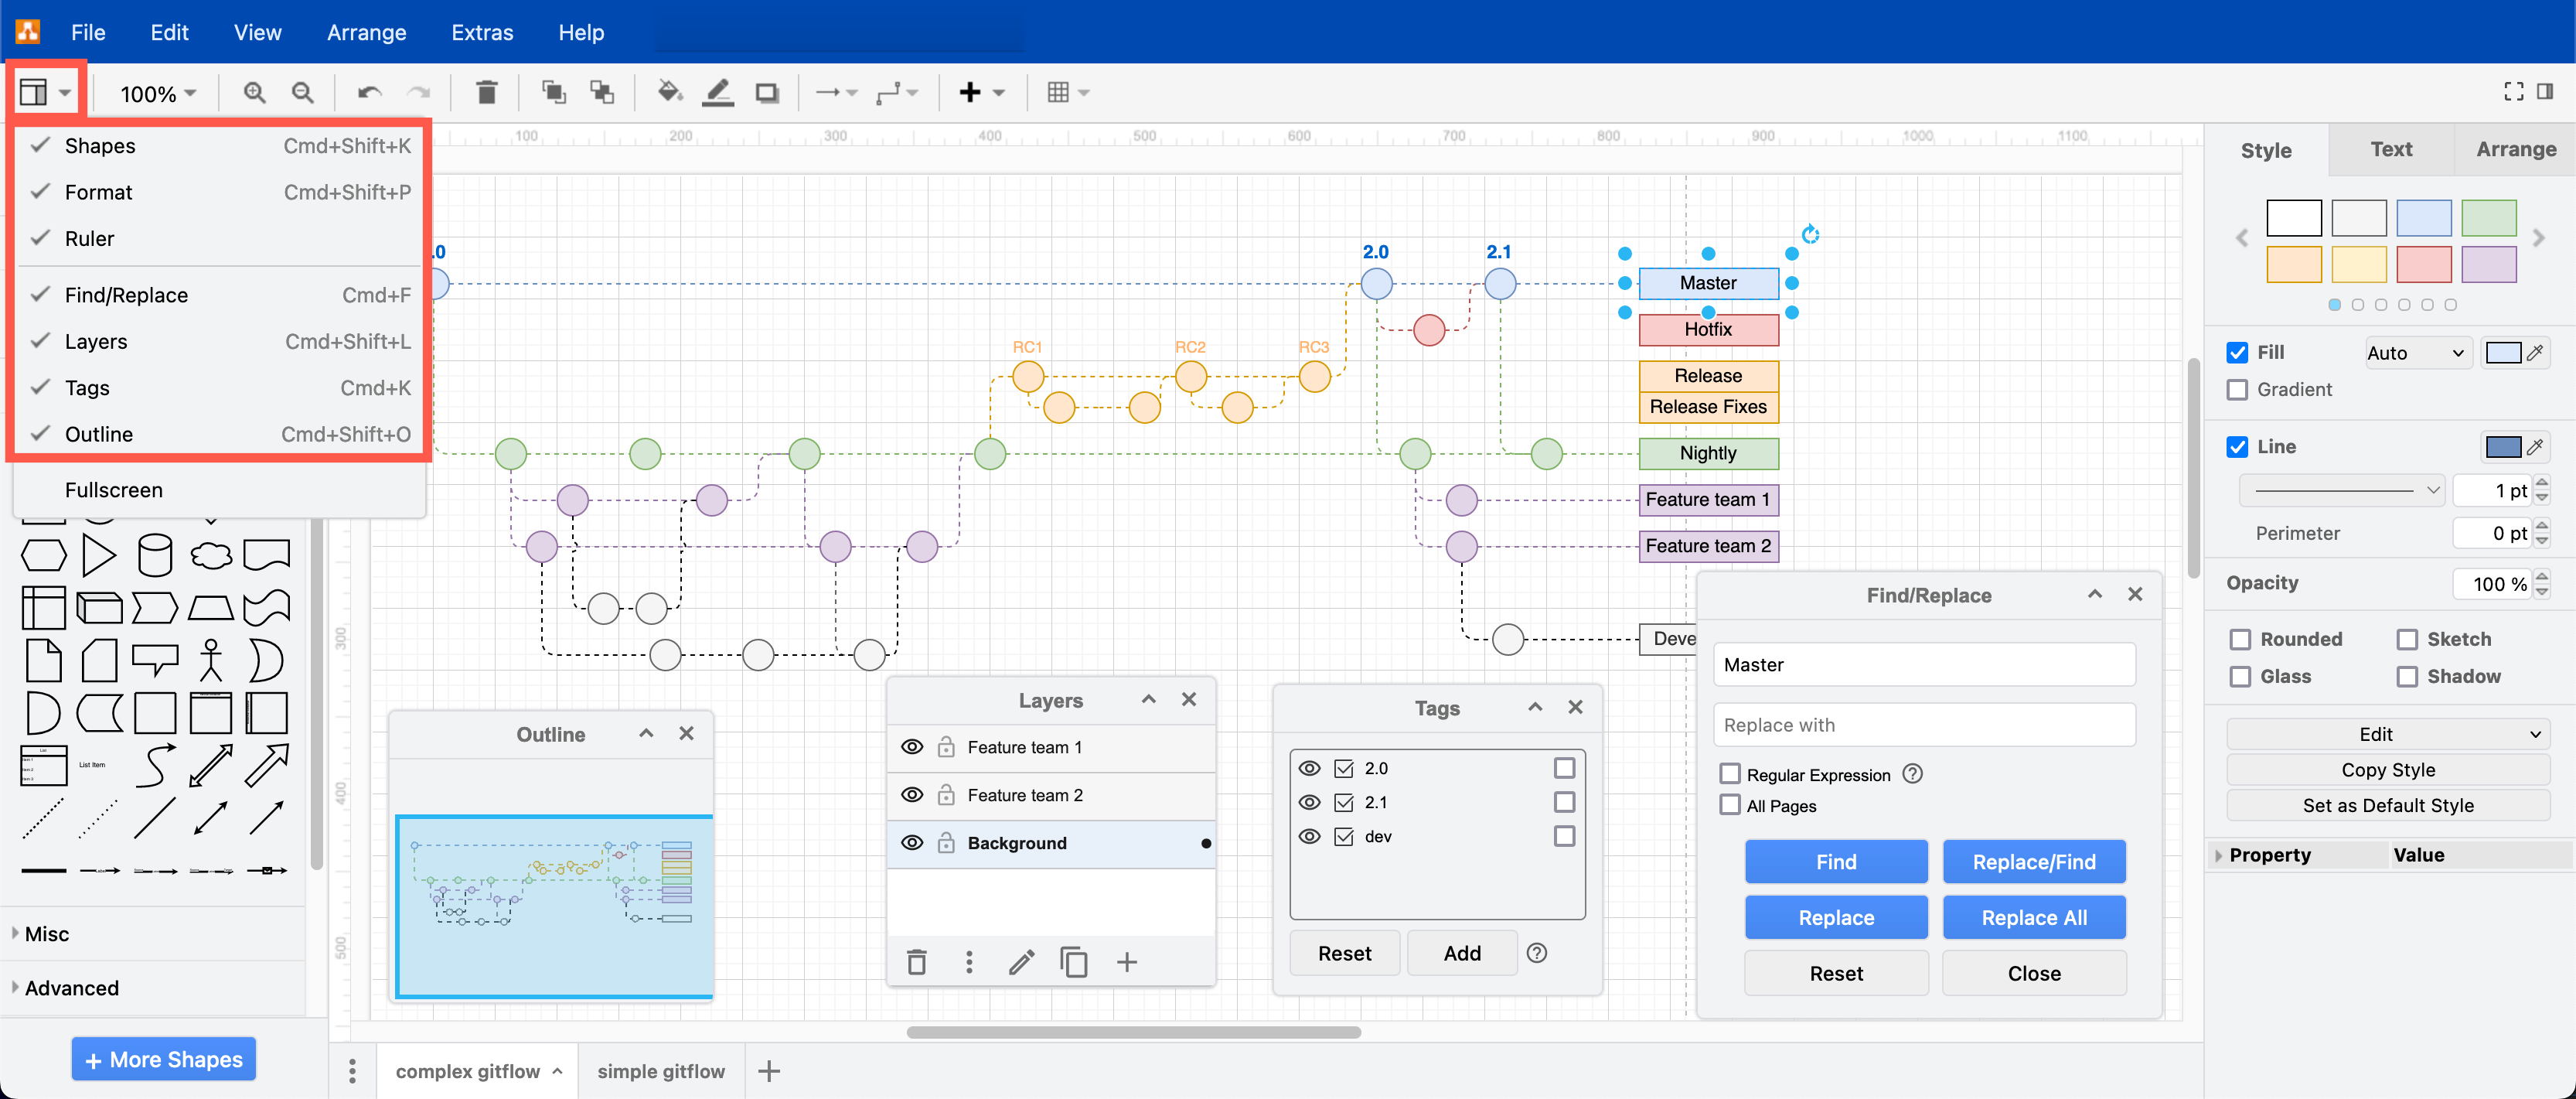
How layers work in draw.io
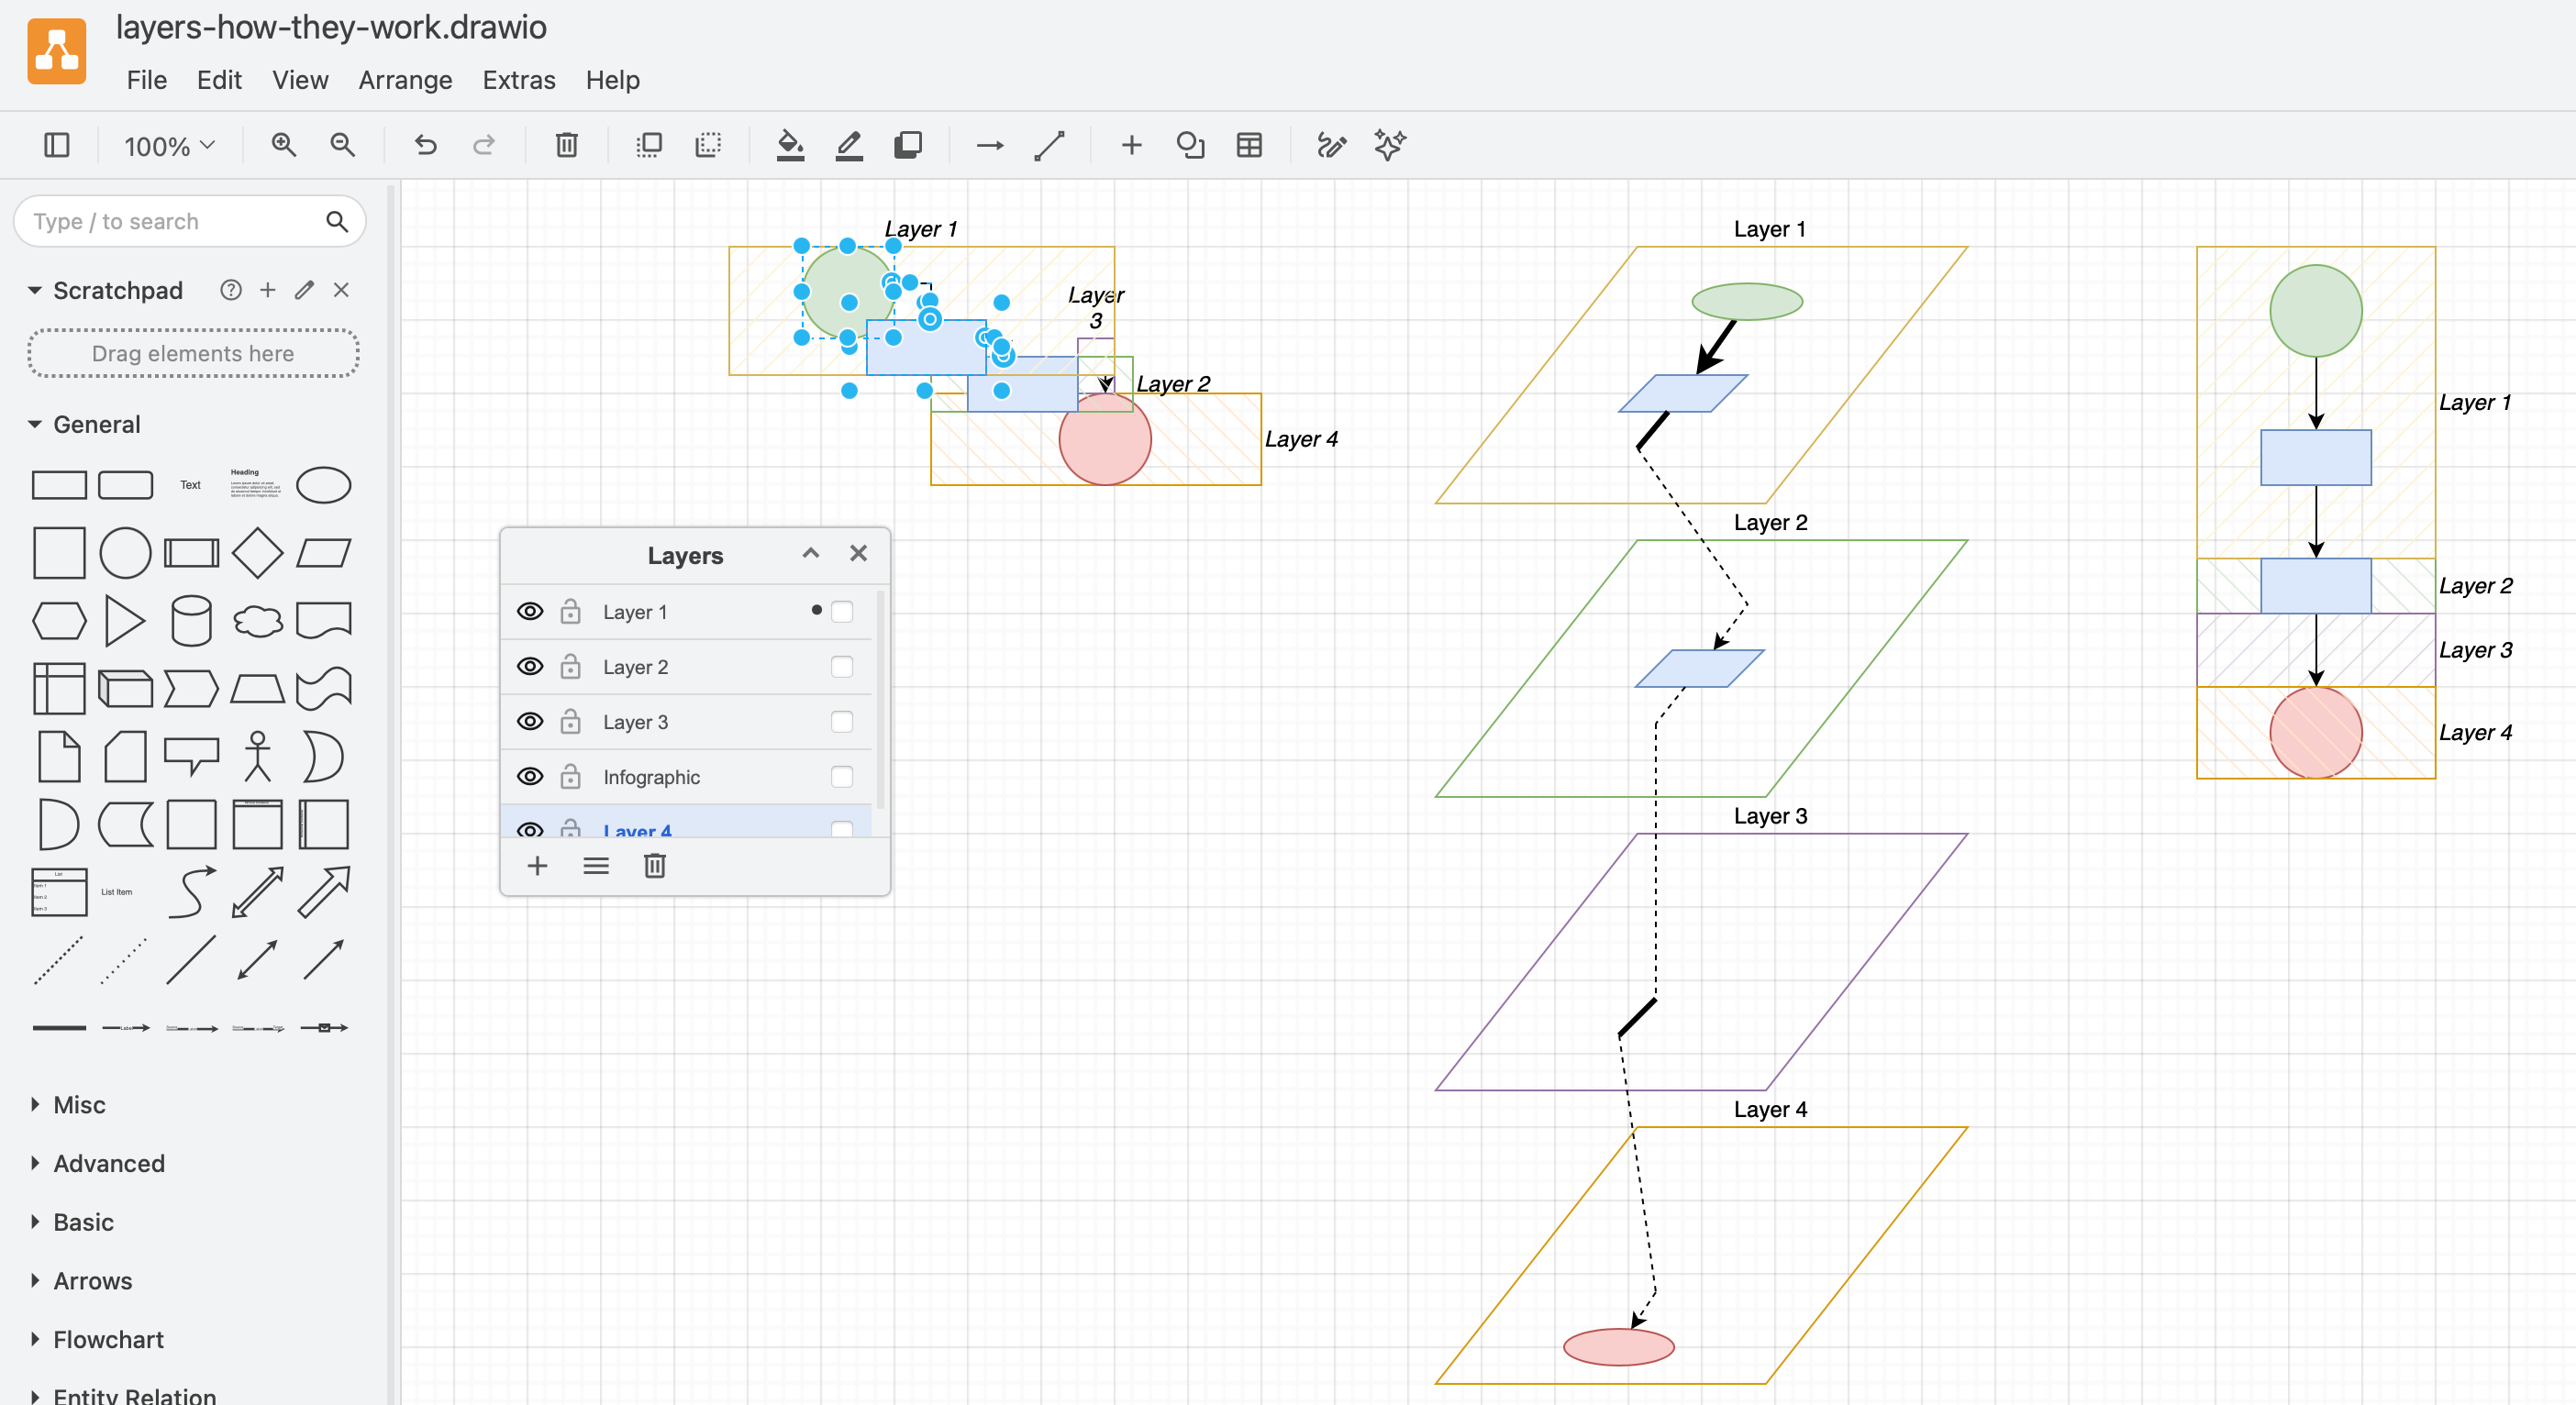
Layers in art, photo and diagram software all work a little differently. In draw.io, unlike in the more artistic drawing tools, you can select diagram objects on different layers and move them together on the drawing canvas - these objects stay in their own layers. Plus, in draw.io, connectors ‘live’ on one layer, but can attach to target and source shapes that ‘live’ on different layers.
20 Jan 2026